Biomechanics and Medicine in Swimming XI
Biomechanics and Medicine in Swimming XI
Biomechanics and Medicine in Swimming XI
You also want an ePaper? Increase the reach of your titles
YUMPU automatically turns print PDFs into web optimized ePapers that Google loves.
Evaluation of Force Production <strong>and</strong> Fatigue us<strong>in</strong>g<br />
an Anaerobic Test Performed by Differently Matured<br />
Swimmers<br />
soares, s., silva, r., Aleixo, I., Machado, l., Fern<strong>and</strong>es, r.J.,<br />
Maia, J., Vilas-Boas, J.P.<br />
University of Porto, Faculty of Sport, Cifi2d, Porto, Portugal<br />
The purpose of this research was to characterize fatigue determ<strong>in</strong><strong>in</strong>g<br />
thresholds <strong>in</strong> force-to-time curves produced dur<strong>in</strong>g 30 second tethered<br />
swimm<strong>in</strong>g efforts. N<strong>in</strong>ety swimmers of three maturational groups took<br />
part <strong>in</strong> the study. Values of maximal, mean, <strong>and</strong> m<strong>in</strong>imum force were determ<strong>in</strong>ed,<br />
as well as the variation coefficient of the mean force. The anaerobic<br />
fatigue thresholds were determ<strong>in</strong>ed on the <strong>in</strong>dividual force-totime<br />
curves, <strong>and</strong> typical stroke cycles were determ<strong>in</strong>ed before <strong>and</strong> after<br />
the fatigue occurrence. Typical force cycles were quantitatively analysed.<br />
It was possible to conclude that force tends to <strong>in</strong>crease with maturation<br />
<strong>in</strong> males. In females, tethered force seems to stabilize after puberty.<br />
Key words: anaerobic performance, fatigue, force, tethered swimm<strong>in</strong>g<br />
IntroductIon<br />
Delay<strong>in</strong>g fatigue is a desire <strong>in</strong> competitive swimm<strong>in</strong>g. In swimm<strong>in</strong>g,<br />
the use of the anaerobic threshold concept has lead to the growth of<br />
scientific knowledge applied to swimm<strong>in</strong>g tra<strong>in</strong><strong>in</strong>g <strong>and</strong> seems to keep<br />
up with performance evolution. That threshold establishes the border<br />
between balanced <strong>and</strong> unbalanced lactate production <strong>and</strong> removal (maximal<br />
full aerobic <strong>and</strong> partially anaerobically supported energy production).<br />
Fatigue studies of anaerobic function <strong>and</strong> high power production<br />
resisted exercises are not so well developed. It is not clear when fatigue<br />
significantly emerges <strong>in</strong> those efforts <strong>and</strong> how to get useful <strong>in</strong>formation<br />
for control <strong>and</strong> plann<strong>in</strong>g of anaerobic swimm<strong>in</strong>g tra<strong>in</strong><strong>in</strong>g. In a previous<br />
study from our group (Soares et al., 2003), we were able to study fatigue<br />
<strong>and</strong> determ<strong>in</strong>e fatigue thresholds on velocity-to-time curves obta<strong>in</strong>ed <strong>in</strong><br />
30 second maximal efforts. Those f<strong>in</strong>d<strong>in</strong>gs made it possible to improve<br />
the control over swimm<strong>in</strong>g plann<strong>in</strong>g <strong>and</strong> tra<strong>in</strong><strong>in</strong>g <strong>in</strong> the anaerobic doma<strong>in</strong>.<br />
The purpose of the present study was to <strong>in</strong>vestigate fatigue <strong>and</strong><br />
determ<strong>in</strong>e fatigue thresholds <strong>in</strong> force-to-time curves produced dur<strong>in</strong>g<br />
30 second bouts of tethered swimm<strong>in</strong>g.<br />
Methods<br />
A total of 90 swimmers (Table 1) divided <strong>in</strong>to three maturational groups<br />
accord<strong>in</strong>g to Tanner (Tanner, Whitehouse et al., 1962) performed a 30<br />
second maximal tethered swimm<strong>in</strong>g test attached by a non-elastic cable<br />
to a stra<strong>in</strong>-gauge system (Globus, Italy). Previously to the start<strong>in</strong>g signal,<br />
swimmers adopted a horizontal position with the cable fully extended<br />
start<strong>in</strong>g the data collection only after the first stroke cycle was completed.<br />
This procedure was used to avoid the <strong>in</strong>ertial effect of the cable<br />
extension usually produced immediately before or dur<strong>in</strong>g the first arm<br />
action. The end of the test was <strong>in</strong>dicated by an acoustic signal. Video<br />
images were captured dur<strong>in</strong>g all the tests us<strong>in</strong>g a JVC camera (JVC GR-<br />
<strong>Biomechanics</strong> SX1EG SVHSC), <strong>and</strong> <strong>Medic<strong>in</strong>e</strong> <strong>and</strong> <strong>in</strong>dividual <strong>in</strong> Swimm<strong>in</strong>g force-to-time <strong>XI</strong> / Chapter 4 Tra<strong>in</strong><strong>in</strong>g curves [F(t)] were Page pro- 128<br />
duced for each session.<br />
us<strong>in</strong>g a JVC camera (JVC GR-SX1EG SVHSC), <strong>and</strong> <strong>in</strong>dividual force-to-time curves<br />
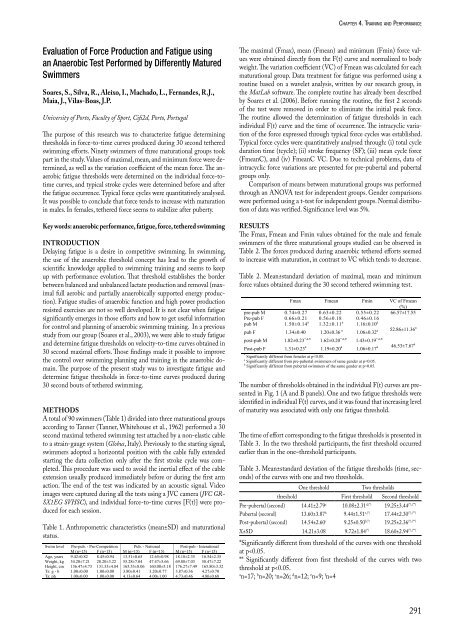
[F(t)] Table were 1. Anthropometric produced for each session. characteristics (mean±SD) <strong>and</strong> maturational<br />
status.<br />
Table 1. Anthropometric characteristics (mean±SD) <strong>and</strong> maturational status.<br />
Swim level Pre-pub. - Pre-Competition Pub. - National Post-pub - Interational<br />
M (n=15) F (n=15) M (n=15) F (n=15) M (n=15) F (n=15)<br />
Age, years 9.42±0.82 8.45±0.94 13.51±0.65 12.65±0.98 18.18±2.35 16.54±2.35<br />
Weight, kg 34.20±7.21 28.20±3.22 55.28±7.04 47.47±5.66 69.88±7.03 58.47±7.22<br />
Height, cm 136.47±4.73 131.33±4.84 165.53±8.06 160.00±5.18 176.27±7.49 165.80±3.32<br />
Ts: g - b 1.00±0.00 1.00±0.00 3.80±0.41 3.20±0.77 3.87±0.36 4.27±0.70<br />
Ts: ph 1.00±0.00 1.00±0.00 4.13±0.64 4.00±1.00 4.73±0.46 4.80±0.68<br />
Pre-pub: pre-pubertal; Pub: pubertal; Post-pub: post pubertal; M: males;<br />
F: females; Ts: g – b: Tanner stage for genitalia or breast; Ts: ph: Tanner<br />
stage for pubic hair.<br />
The maximal (Fmax), mean (Fmean) <strong>and</strong> m<strong>in</strong>imum (Fm<strong>in</strong>) force values were obta<strong>in</strong>ed<br />
directly from the F(t) curve <strong>and</strong> normalized to body weight. The variation coefficient<br />
(VC) of Fmean was calculated for each maturational group. Data treatment for fatigue<br />
was performed us<strong>in</strong>g a rout<strong>in</strong>e based on a wavelet analysis, written by our research<br />
group, <strong>in</strong> the MatLab software. The complete rout<strong>in</strong>e has already been described by<br />
Soares et al. (2006). Before runn<strong>in</strong>g the rout<strong>in</strong>e, the first 2 seconds of the test were<br />
chaPter4.tra<strong>in</strong><strong>in</strong>g<strong>and</strong>Performance<br />
The maximal (Fmax), mean (Fmean) <strong>and</strong> m<strong>in</strong>imum (Fm<strong>in</strong>) force values<br />
were obta<strong>in</strong>ed directly from the F(t) curve <strong>and</strong> normalized to body<br />
weight. The variation coefficient (VC) of Fmean was calculated for each<br />
maturational group. Data treatment for fatigue was performed us<strong>in</strong>g a<br />
rout<strong>in</strong>e based on a wavelet analysis, written by our research group, <strong>in</strong><br />
the MatLab software. The complete rout<strong>in</strong>e has already been described<br />
by Soares et al. (2006). Before runn<strong>in</strong>g the rout<strong>in</strong>e, the first 2 seconds<br />
of the test were removed <strong>in</strong> order to elim<strong>in</strong>ate the <strong>in</strong>itial peak force.<br />
The rout<strong>in</strong>e allowed the determ<strong>in</strong>ation of fatigue thresholds <strong>in</strong> each<br />
<strong>in</strong>dividual F(t) curve <strong>and</strong> the time of occurrence. The <strong>in</strong>tracyclic variation<br />
of the force expressed through typical force cycles was established.<br />
Typical force cycles were quantitatively analysed through: (i) total cycle<br />
duration time (tcycle); (ii) stroke frequency (SF); (iii) mean cycle force<br />
(FmeanC), <strong>and</strong> (iv) FmeanC VC. Due to technical problems, data of<br />
<strong>in</strong>tracyclic force variations are presented for pre-pubertal <strong>and</strong> pubertal<br />
groups only.<br />
Comparison of means between maturational groups was performed<br />
through an ANOVA test for <strong>in</strong>dependent groups. Gender comparisons<br />
were performed us<strong>in</strong>g a t-test for <strong>in</strong>dependent groups. Normal distribution<br />
of data was verified. Significance level was 5%.<br />
results<br />
The Fmax, Fmean <strong>and</strong> Fm<strong>in</strong> values obta<strong>in</strong>ed for the male <strong>and</strong> female<br />
swimmers of the three maturational groups studied can be observed <strong>in</strong><br />
Table 2. The forces produced dur<strong>in</strong>g anaerobic tethered efforts seemed<br />
<strong>Biomechanics</strong> <strong>and</strong> <strong>Medic<strong>in</strong>e</strong> <strong>in</strong> Swimm<strong>in</strong>g <strong>XI</strong> / Chapter 4 Tra<strong>in</strong><strong>in</strong>g Page 129<br />
to <strong>in</strong>crease with maturation, <strong>in</strong> contrast to VC which tends to decrease.<br />
Table 2. Mean±st<strong>and</strong>ard deviation of maximal, mean <strong>and</strong> m<strong>in</strong>imum<br />
force values obta<strong>in</strong>ed dur<strong>in</strong>g the 30 second tethered swimm<strong>in</strong>g test.<br />
Table 2. Mean±st<strong>and</strong>ard deviation of maximal, mean <strong>and</strong> m<strong>in</strong>imum force values<br />
obta<strong>in</strong>ed dur<strong>in</strong>g the 30 second tethered swimm<strong>in</strong>g test.<br />
Fmax Fmean Fm<strong>in</strong> VC of Fmean<br />
(%)<br />
pre-pub M 0.74±0.27 0.63±0.22 0.55±0.22 66.57±17.55<br />
Pre-pub F 0.66±0.21 0.56±0.18 0.46±0.16<br />
pub M 1.50±0.14 a 1.32±0.11 a 1.16±0.10 a<br />
52.86±11.36 a<br />
pub F 1.34±0.40 1.20±0.36 a 1.06±0.32 a<br />
post-pub M 1.82±0.23 *,a,b 1.62±0.20 *,a,b 1.43±0.19 *,a,b<br />
46.53±7.67 a<br />
Post-pub F 1.31±0.23 a 1.19±0.20 a 1.06±0.17 a<br />
*<br />
Significantly different from females at p


