Biomechanics and Medicine in Swimming XI
Biomechanics and Medicine in Swimming XI
Biomechanics and Medicine in Swimming XI
You also want an ePaper? Increase the reach of your titles
YUMPU automatically turns print PDFs into web optimized ePapers that Google loves.
(test 2), however, all BACs are <strong>in</strong>tegrated <strong>in</strong> clusters, the distances are<br />
smaller <strong>and</strong> the nodes are <strong>in</strong> regularity. After the twelve weeks tra<strong>in</strong><strong>in</strong>g<br />
period (test 3) the structure is quite stabilized, some distances are once<br />
aga<strong>in</strong> reduced (p. E. 9 <strong>and</strong> 10, 5 <strong>and</strong> 6) but also some (p. e. 3 <strong>and</strong> 4, 7 <strong>and</strong><br />
8) <strong>in</strong>creased.<br />
The follow<strong>in</strong>g schedule shows a way to transfer the structure of the dendrograms<br />
above <strong>in</strong>to a schedule to compare it directly. Each dendrogram<br />
<strong>Biomechanics</strong> <strong>and</strong> <strong>Medic<strong>in</strong>e</strong> <strong>in</strong> Swimm<strong>in</strong>g <strong>XI</strong> / Chapter 4 Tra<strong>in</strong><strong>in</strong>g Page 111<br />
shows 2 ma<strong>in</strong> groups, but only test (2) <strong>and</strong> (3) shows 3 <strong>and</strong> 4 clusters.<br />
At test (2) there are 6 nodes (2 clusters) <strong>in</strong> the ma<strong>in</strong> group 1, at test (3)<br />
7 nodes (3 clusters). Accord<strong>in</strong>g to ma<strong>in</strong> group 1 are <strong>in</strong> ma<strong>in</strong> group 2 at<br />
test The follow<strong>in</strong>g (2) 4 nodes schedule (1 cluster) shows a way <strong>and</strong> to at transfer test the (3) structure 3 nodes of (1 the cluster). dendrograms The above real<br />
<strong>in</strong>to <strong>Biomechanics</strong> a schedule <strong>and</strong> to compare <strong>Medic<strong>in</strong>e</strong> it <strong>in</strong> directly. Swimm<strong>in</strong>g Each <strong>XI</strong> dendrogram / Chapter shows 4 Tra<strong>in</strong><strong>in</strong>g 2 ma<strong>in</strong> groups, Page but only 111<br />
distances test (2) <strong>and</strong> between (3) shows 3 the <strong>and</strong> s<strong>in</strong>gle 4 clusters. nodes At test cannot (2) there be are shown 6 nodes <strong>in</strong> (2 the clusters) schedule, <strong>in</strong> the<br />
these ma<strong>in</strong> group details 1, at are test only (3) 7 visible nodes (3 directly clusters). <strong>in</strong> Accord<strong>in</strong>g the dendrograms. to ma<strong>in</strong> group 1 are <strong>in</strong> ma<strong>in</strong><br />
group 2 at test (2) 4 nodes (1 cluster) <strong>and</strong> at test (3) 3 nodes (1 cluster). The real<br />
distances between the s<strong>in</strong>gle nodes cannot be shown <strong>in</strong> the schedule, these details are<br />
Tab. The follow<strong>in</strong>g 1 Schedule schedule of representational shows a way to transfer<br />
only visible directly <strong>in</strong> the dendrograms. structure the structure for one of the swimmer dendrograms at above<br />
<strong>Biomechanics</strong> three<br />
<strong>in</strong>to a schedule <strong>and</strong> to <strong>Medic<strong>in</strong>e</strong> compare <strong>in</strong> it directly. Swimm<strong>in</strong>g Each <strong>XI</strong> dendrogram / Chapter 4 Tra<strong>in</strong><strong>in</strong>g shows 2 ma<strong>in</strong> groups, Page but 111 only<br />
tests test (2) <strong>and</strong> (3) shows 3 <strong>and</strong> 4 clusters. At test (2) there are 6 nodes (2 clusters) <strong>in</strong> the<br />
Tab. 1 Schedule of representational structure for one swimmer at three tests<br />
ma<strong>in</strong> group 1, at test (3) 7 nodes (3 clusters). Accord<strong>in</strong>g to ma<strong>in</strong> group 1 are <strong>in</strong> ma<strong>in</strong><br />
Number of Number of<br />
group Test 2 at test (2) 4 nodes (1 cluster) BAC <strong>and</strong> ma<strong>in</strong> at test group (3) 1 3 nodes BAC (1 ma<strong>in</strong> cluster). group The 2 real<br />
ma<strong>in</strong> groups Cluster<br />
The distances<br />
Test follow<strong>in</strong>g between<br />
1 2 schedule the shows s<strong>in</strong>gle<br />
0 a nodes way to cannot<br />
1,2,4 transfer be the shown structure <strong>in</strong> the of schedule,<br />
5,8,9,10,7,3 the dendrograms these details above are<br />
<strong>in</strong>to only<br />
Test a schedule visible directly<br />
2 2 to compare <strong>in</strong> the<br />
3 it dendrograms. directly. Each {9,10} dendrogram {1,2,3,4} shows {5,6,7,8} 2 ma<strong>in</strong> groups, but only<br />
test Test (2) 3 <strong>and</strong> 2 (3) shows 3 <strong>and</strong> 4 4 clusters. {8,9,10}{1,2}{3,4} At test (2) there are 6 nodes {5,6,7} (2 clusters) <strong>in</strong> the<br />
ma<strong>in</strong> Tab. group 1 Schedule 1, at test of representational (3) 7 nodes (3 structure clusters). for Accord<strong>in</strong>g one swimmer to ma<strong>in</strong> at three group tests 1 are <strong>in</strong> ma<strong>in</strong><br />
group<br />
The Test improvement 2 at Number test (2) of<br />
<strong>in</strong> 4 mental nodes Number (1 representation cluster) of<br />
improvement <strong>in</strong> mental representation BAC <strong>and</strong> shown ma<strong>in</strong> at test group as (3) example 3<br />
shown 1 nodes BAC for (1<br />
as one example ma<strong>in</strong> cluster). swimmer group The<br />
for 2 above real<br />
one<br />
distances also led between ma<strong>in</strong> groups<br />
to improvements the s<strong>in</strong>gle Cluster<br />
<strong>in</strong> nodes the swimm<strong>in</strong>g cannot be parameters shown <strong>in</strong> the (also schedule, shown for these one details swimmer are<br />
only swimmer Test<br />
below). visible 1 2<br />
Accord<strong>in</strong>g directly above <strong>in</strong> also to the REISCHLE dendrograms. led 0 to improvements 1,2,4<br />
(1988) <strong>and</strong> Arellano <strong>in</strong> the et swimm<strong>in</strong>g 5,8,9,10,7,3<br />
al. (1991) the parameters follow<strong>in</strong>g<br />
Test 2 2 3 {9,10} {1,2,3,4} {5,6,7,8}<br />
(also parameters shown were for selected one swimmer to demonstrate below). technical Accord<strong>in</strong>g progress: to REISCHLE first, stroke length (1988) <strong>and</strong><br />
Tab. Test<br />
second, 1 Schedule 3 2<br />
stroke <strong>in</strong>dex of representational 4<br />
which comb<strong>in</strong>es structure {8,9,10}{1,2}{3,4}<br />
stroke for length one swimmer <strong>and</strong> swimm<strong>in</strong>g at {5,6,7} three speed. tests<br />
<strong>and</strong> Arellano<br />
The follow<strong>in</strong>g Number schedule of et al. Number (1991)<br />
lists the of the follow<strong>in</strong>g parameters were selected to<br />
Test<br />
time (10 metres) (t), speed (v), stroke rate (sr), length<br />
demonstrate The improvement<br />
(d) <strong>and</strong> the stroke technical <strong>in</strong> mental<br />
<strong>in</strong>dex (si) of progress: representation BAC ma<strong>in</strong><br />
the example first, shown group<br />
swimmer. stroke as example 1 BAC<br />
length for ma<strong>in</strong><br />
<strong>and</strong> one second, swimmer group 2<br />
ma<strong>in</strong> groups Cluster<br />
stroke above<br />
Test also 1 led 2 to improvements 0 <strong>in</strong> the swimm<strong>in</strong>g 1,2,4 parameters (also 5,8,9,10,7,3 shown for one swimmer<br />
Test <strong>in</strong>dex below). which comb<strong>in</strong>es stroke length <strong>and</strong> swimm<strong>in</strong>g speed.<br />
Tab. 2 Biomechanical 2 Accord<strong>in</strong>g to REISCHLE<br />
data 3 (1988)<br />
of one swimmer {9,10} at {1,2,3,4} <strong>and</strong> Arellano et<br />
test (1), (2) <strong>and</strong> {5,6,7,8} al. (1991) the follow<strong>in</strong>g<br />
(3)<br />
Test The parameters 3 follow<strong>in</strong>g 2 were<br />
Test 1 schedule selected 4 to lists demonstrate the {8,9,10}{1,2}{3,4} Test time technical<br />
2 (10 metres) progress: {5,6,7} (t), first, speed stroke<br />
Test 3 (v), length stroke <strong>and</strong><br />
second, stroke <strong>in</strong>dex which comb<strong>in</strong>es stroke length <strong>and</strong> swimm<strong>in</strong>g speed.<br />
rate t (sr), v length sr d (d) <strong>and</strong> si the t stroke v sr <strong>in</strong>dex d (si) si of the t example v sr swimmer. d si<br />
The The<br />
6.52 improvement follow<strong>in</strong>g schedule<br />
1.53 53 <strong>in</strong> 1.76 mental lists<br />
4.08 representation the time (10<br />
6.64 1.51 47 shown metres)<br />
1.92 as (t), example speed (v),<br />
4.36 6.66for stroke<br />
1.50 one swimmer rate (sr),<br />
48 1.88 above length<br />
4.23<br />
also (d)<br />
6.64 led <strong>and</strong><br />
1.49 to the improvements stroke <strong>in</strong>dex (si)<br />
50 1.81 4.10 <strong>in</strong> of the the<br />
6.22 swimm<strong>in</strong>g example swimmer.<br />
1.57 46 parameters 2.04 5.02 (also 6.64 shown 1.51 for 48 one 1.88 swimmer 4.27<br />
below). Tab. 2 Accord<strong>in</strong>g Biomechanical to REISCHLE data of (1988) one swimmer <strong>and</strong> Arellano at test et al. (1), (1991) (2) <strong>and</strong> the follow<strong>in</strong>g (3)<br />
parameters Tab. 2 Biomechanical<br />
From test 1 were to test selected data<br />
2 (tra<strong>in</strong><strong>in</strong>g to of demonstrate one swimmer at test (1), (2) <strong>and</strong> (3)<br />
period) the technical average progress: speed <strong>in</strong>creased first, stroke a little, length the stroke <strong>and</strong><br />
second, Test 1 Test 2 Test 3<br />
length clearly, stroke <strong>in</strong>dex while which the stroke comb<strong>in</strong>es rate decreased. stroke length Thus, <strong>and</strong> the swimm<strong>in</strong>g stroke-<strong>in</strong>dex speed. also <strong>in</strong>creased. At<br />
The t v sr d si t v sr d si t v sr d si<br />
test follow<strong>in</strong>g 3 the average schedule speed lists decreased the time a bit. (10 The metres) stroke (t), rate, speed the (v), stroke stroke length rate <strong>and</strong> (sr), the length stroke<br />
(d) 6.52 1.53 53 1.76 4.08 6.64 1.51 47 1.92 4.36 6.66 1.50 48 1.88 4.23<br />
<strong>in</strong>dex <strong>and</strong> were the stroke stabilized <strong>in</strong>dex on (si) a level of the between example test swimmer. (1) <strong>and</strong> test (2).<br />
6.64 1.49 50 1.81 4.10 6.22 1.57 46 2.04 5.02 6.64 1.51 48 1.88 4.27<br />
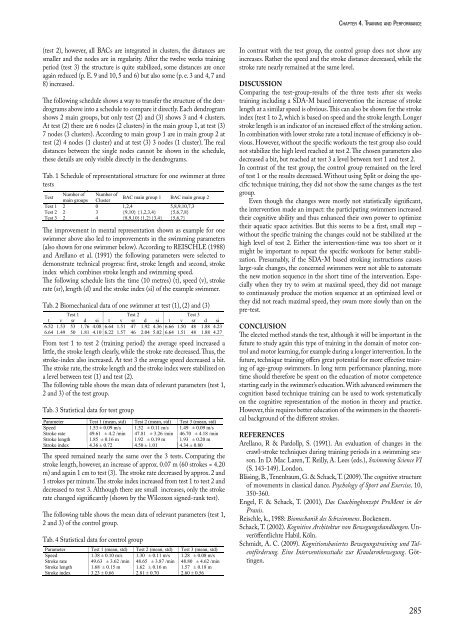
The follow<strong>in</strong>g table shows the mean data of relevant parameters (test 1, 2 <strong>and</strong> 3) of the<br />
Tab. test 2 group. Biomechanical data of one swimmer at test (1), (2) <strong>and</strong> (3)<br />
From test Test 1 to 1 1 to test test 2 (tra<strong>in</strong><strong>in</strong>g 2 (tra<strong>in</strong><strong>in</strong>g period) Test the period) 2 average the speed average <strong>in</strong>creased speed Test a little, 3 <strong>in</strong>creased the stroke a<br />
little, length clearly, while the stroke rate decreased. Thus, the stroke-<strong>in</strong>dex also <strong>in</strong>creased. At<br />
Tab. t 3 v the Statistical stroke sr data d length for si test clearly, group t v while sr the d stroke si rate t decreased. v sr d Thus, si the<br />
6.52 test 3 the average speed decreased a bit. The stroke rate, the stroke length <strong>and</strong> the stroke<br />
Parameter 1.53 53 1.76 4.08 Test 6.64 1 (mean, 1.51std) 47<br />
stroke-<strong>in</strong>dex Test 1.922 4.36 (mean, 6.66 std) 1.50 Test 48 3 (mean, 1.88 4.23 std)<br />
<strong>in</strong>dex were stabilized also <strong>in</strong>creased. on a level between At test test 3 (1) the <strong>and</strong> average test (2). speed decreased a bit.<br />
6.64 Speed 1.49 50 1.81 4.10 1.53 6.22 ± 0.09 1.57 m/s 46 1.52 2.04 ± 5.02 0.11 6.64 m/s 1.51 1.49 48 ± 1.88 0.09 m/s 4.27<br />
The follow<strong>in</strong>g table shows the mean data of relevant parameters (test 1, 2 <strong>and</strong> 3) of the<br />
Stroke stroke rate rate, the 49.61 stroke ± length 4.2 /m<strong>in</strong> <strong>and</strong> 47.81 the stroke ± 3.26 <strong>in</strong>dex /m<strong>in</strong> were 46.70 stabilized ± 4.18 /m<strong>in</strong> on<br />
From test group.<br />
a Stroke level test length between 1 to test 2 test (tra<strong>in</strong><strong>in</strong>g 1.85 (1) <strong>and</strong> ± period) 0.16 test m the (2). average 1.92 speed ± 0.19 <strong>in</strong>creased m 1.93 a little, ± 0.20 the stroke m<br />
length Stroke clearly, <strong>in</strong>dex while the stroke 4.36 ± rate 0.72 decreased. 4.50 Thus, ± the 1.01 stroke-<strong>in</strong>dex 4.34 also ± <strong>in</strong>creased. 0.80 At<br />
test The Tab. 3 the follow<strong>in</strong>g 3 Statistical average speed data table for decreased shows test group the a bit. mean The stroke data rate, of relevant the stroke length parameters <strong>and</strong> the (test stroke 1,<br />
<strong>in</strong>dex Parameter Test 1 (mean, std) Test 2 (mean, std) Test 3 (mean, std)<br />
2 The <strong>and</strong> speed were 3) stabilized of rema<strong>in</strong>ed the test on nearly a group. level the between same over test (1) the <strong>and</strong> 3 tests. test (2). Compar<strong>in</strong>g the stroke length,<br />
The Speed 1.53 ± 0.09 m/s 1.52 ± 0.11 m/s 1.49 ± 0.09 m/s<br />
however, follow<strong>in</strong>g an <strong>in</strong>crease table shows of approx. the mean 0.07 data m (60 of strokes relevant = parameters 4.20 m) <strong>and</strong> (test aga<strong>in</strong> 1, 2 1 <strong>and</strong> cm to 3) test of the (3).<br />
test Stroke rate 49.61 ± 4.2 /m<strong>in</strong> 47.81 ± 3.26 /m<strong>in</strong> 46.70 ± 4.18 /m<strong>in</strong><br />
The group. stroke rate decreased by approx. 2 <strong>and</strong> 1 strokes per m<strong>in</strong>ute. The stroke <strong>in</strong>dex<br />
Tab. Stroke length 1.85 ± 0.16 m 1.92 ± 0.19 m 1.93 ± 0.20 m<br />
<strong>in</strong>creased 3 Statistical from test data 1 to test for 2 test <strong>and</strong> group decreased to test 3. Although there are small<br />
Tab. Stroke 3 Statistical <strong>in</strong>dex data for 4.36 test group ± 0.72 4.50 ± 1.01 4.34 ± 0.80<br />
Parameter Test 1 (mean, std) Test 2 (mean, std) Test 3 (mean, std)<br />
Speed The speed rema<strong>in</strong>ed nearly 1.53 ± 0.09 the same m/s over 1.52 the 3 ± tests. 0.11 m/s Compar<strong>in</strong>g 1.49 the ± stroke 0.09 m/s length,<br />
Stroke however, rate an <strong>in</strong>crease of 49.61 approx. ± 4.2 0.07 /m<strong>in</strong> m (60 strokes 47.81 = ± 4.20 3.26 m) /m<strong>in</strong> <strong>and</strong> aga<strong>in</strong> 46.70 1 ± cm 4.18 to test /m<strong>in</strong> (3).<br />
Stroke The stroke length rate decreased 1.85 ± by 0.16 approx. m 2 <strong>and</strong> 1.92 1 strokes ± 0.19 per m m<strong>in</strong>ute. 1.93 The ± 0.20 stroke m <strong>in</strong>dex<br />
Stroke <strong>in</strong>creased <strong>in</strong>dex from test 1 4.36 to ± test 0.72 2 <strong>and</strong> decreased 4.50 ± to 1.01 test 3. Although 4.34 ± there 0.80 are small<br />
The speed rema<strong>in</strong>ed nearly the same over the 3 tests. Compar<strong>in</strong>g the<br />
stroke length, however, an <strong>in</strong>crease of approx. 0.07 m (60 strokes = 4.20<br />
m) <strong>and</strong> aga<strong>in</strong> 1 cm to test (3). The stroke rate decreased by approx. 2 <strong>and</strong><br />
1 strokes per m<strong>in</strong>ute. The stroke <strong>in</strong>dex <strong>in</strong>creased from test 1 to test 2 <strong>and</strong><br />
decreased <strong>Biomechanics</strong> to <strong>and</strong> test <strong>Medic<strong>in</strong>e</strong> 3. Although <strong>in</strong> Swimm<strong>in</strong>g there <strong>XI</strong> are / Chapter small 4 <strong>in</strong>creases, Tra<strong>in</strong><strong>in</strong>g only the Page stroke 112<br />
rate changed significantly (shown by the Wilcoxon signed-rank test).<br />
The speed rema<strong>in</strong>ed nearly the same over the 3 tests. Compar<strong>in</strong>g the stroke length,<br />
however, an <strong>in</strong>crease of approx. 0.07 m (60 strokes = 4.20 m) <strong>and</strong> aga<strong>in</strong> 1 cm to test (3).<br />
The stroke rate decreased by approx. 2 <strong>and</strong> 1 strokes per m<strong>in</strong>ute. The stroke <strong>in</strong>dex<br />
<strong>in</strong>creased from test 1 to test 2 <strong>and</strong> decreased to test 3. Although there are small<br />
<strong>in</strong>creases, only the stroke rate changed significantly (shown by the Wilcoxon signed-<br />
The rank test). follow<strong>in</strong>g table shows the mean data of relevant parameters (test 1,<br />
2 <strong>and</strong> 3) of the control group.<br />
The follow<strong>in</strong>g table shows the mean data of relevant parameters (test 1, 2 <strong>and</strong> 3) of the<br />
control group.<br />
Tab. 4 Statistical data for control group<br />
Tab. 4 Statistical data for control group<br />
Parameter Test 1 (mean, std) Test 2 (mean, std) Test 3 (mean, std)<br />
Speed 1.38 ± 0.10 m/s 1.30 ± 0.11 m/s 1.28 ± 0.08 m/s<br />
Stroke rate 49.63 ± 3.62 /m<strong>in</strong> 48.65 ± 3.87 /m<strong>in</strong> 48.80 ± 4.62 /m<strong>in</strong><br />
Stroke length 1.68 ± 0.15 m 1.62 ± 0.16 m 1.57 ± 0.18 m<br />
Stroke <strong>in</strong>dex 3.23 ± 0.66 2.81 ± 0.70 2.60 ± 0.56<br />
In contrast with the test group, the control group does not show any <strong>in</strong>creases. Rather<br />
the speed <strong>and</strong> the stroke distance decreased, while the stroke rate nearly rema<strong>in</strong>ed at the<br />
same level.<br />
DISCUSSION<br />
Compar<strong>in</strong>g the test-group-results of the three tests after six weeks tra<strong>in</strong><strong>in</strong>g <strong>in</strong>clud<strong>in</strong>g a<br />
SDA-M based <strong>in</strong>tervention the <strong>in</strong>crease of stroke length at a similar speed is obvious.<br />
This can also be shown for the stroke <strong>in</strong>dex (test 1 to 2, which is based on speed <strong>and</strong> the<br />
stroke length. Longer stroke length is an <strong>in</strong>dicator of an <strong>in</strong>creased effect of the strok<strong>in</strong>g<br />
action. In comb<strong>in</strong>ation with lower stroke rate a total <strong>in</strong>crease of efficiency is obvious.<br />
chaPter4.tra<strong>in</strong><strong>in</strong>g<strong>and</strong>Performance<br />
In contrast with the test group, the control group does not show any<br />
<strong>in</strong>creases. Rather the speed <strong>and</strong> the stroke distance decreased, while the<br />
stroke rate nearly rema<strong>in</strong>ed at the same level.<br />
dIscussIon<br />
Compar<strong>in</strong>g the test-group-results of the three tests after six weeks<br />
tra<strong>in</strong><strong>in</strong>g <strong>in</strong>clud<strong>in</strong>g a SDA-M based <strong>in</strong>tervention the <strong>in</strong>crease of stroke<br />
length at a similar speed is obvious. This can also be shown for the stroke<br />
<strong>in</strong>dex (test 1 to 2, which is based on speed <strong>and</strong> the stroke length. Longer<br />
stroke length is an <strong>in</strong>dicator of an <strong>in</strong>creased effect of the strok<strong>in</strong>g action.<br />
In comb<strong>in</strong>ation with lower stroke rate a total <strong>in</strong>crease of efficiency is obvious.<br />
However, without the specific workouts the test group also could<br />
not stabilize the high level reached at test 2. The chosen parameters also<br />
decreased a bit, but reached at test 3 a level between test 1 <strong>and</strong> test 2.<br />
In contrast of the test group, the control group rema<strong>in</strong>ed on the level<br />
of test 1 or the results decreased. Without us<strong>in</strong>g Split or do<strong>in</strong>g the specific<br />
technique tra<strong>in</strong><strong>in</strong>g, they did not show the same changes as the test<br />
group.<br />
Even though the changes were mostly not statistically significant,<br />
the <strong>in</strong>tervention made an impact: the participat<strong>in</strong>g swimmers <strong>in</strong>creased<br />
their cognitive ability <strong>and</strong> thus enhanced their own power to optimize<br />
their aquatic space activities. But this seems to be a first, small step –<br />
without the specific tra<strong>in</strong><strong>in</strong>g the changes could not be stabilized at the<br />
high level of test 2. Either the <strong>in</strong>tervention-time was too short or it<br />
might be important to repeat the specific workouts for better stabilization.<br />
Presumably, if the SDA-M based strok<strong>in</strong>g <strong>in</strong>structions causes<br />
large-sale changes, the concerned swimmers were not able to automate<br />
the new motion sequence <strong>in</strong> the short time of the <strong>in</strong>tervention. Especially<br />
when they try to swim at maximal speed, they did not manage<br />
to cont<strong>in</strong>uously produce the motion sequence at an optimized level or<br />
they did not reach maximal speed, they swam more slowly than on the<br />
pre-test.<br />
conclusIon<br />
The elected method st<strong>and</strong>s the test, although it will be important <strong>in</strong> the<br />
future to study aga<strong>in</strong> this type of tra<strong>in</strong><strong>in</strong>g <strong>in</strong> the doma<strong>in</strong> of motor control<br />
<strong>and</strong> motor learn<strong>in</strong>g, for example dur<strong>in</strong>g a longer <strong>in</strong>tervention. In the<br />
future, technique tra<strong>in</strong><strong>in</strong>g offers great potential for more effective tra<strong>in</strong><strong>in</strong>g<br />
of age-group swimmers. In long term performance plann<strong>in</strong>g, more<br />
time should therefore be spent on the education of motor competence<br />
start<strong>in</strong>g early <strong>in</strong> the swimmer’s education. With advanced swimmers the<br />
cognition based technique tra<strong>in</strong><strong>in</strong>g can be used to work systematically<br />
on the cognitive representation of the motion <strong>in</strong> theory <strong>and</strong> practice.<br />
However, this requires better education of the swimmers <strong>in</strong> the theoretical<br />
background of the different strokes.<br />
reFerences<br />
Arellano, R & Pardollp, S. (1991). An evaluation of changes <strong>in</strong> the<br />
crawl-stroke techniques dur<strong>in</strong>g tra<strong>in</strong><strong>in</strong>g periods <strong>in</strong> a swimm<strong>in</strong>g season.<br />
In D. Mac Laren, T. Reilly, A. Lees (eds.), Swimm<strong>in</strong>g Science VI<br />
(S. 143-149). London.<br />
Bläs<strong>in</strong>g, B., Tenenbaum, G. & Schack, T. (2009). The cognitive structure<br />
of movements <strong>in</strong> classical dance. Psychology of Sport <strong>and</strong> Exercise, 10,<br />
350-360.<br />
Engel, F. & Schack, T. (2001), Das Coach<strong>in</strong>gkonzept ProMent <strong>in</strong> der<br />
Praxis.<br />
Reischle, k., 1988: Biomechanik des Schwimmens. Bockenem.<br />
Schack, T. (2002). Kognitive Architektur von Bewegungsh<strong>and</strong>lungen. Unveröffentlichte<br />
Habil. Köln.<br />
Schmidt, A. C. (2009). Kognitionsbasiertes Bewegungstra<strong>in</strong><strong>in</strong>g und Talentförderung.<br />
E<strong>in</strong>e Interventionsstudie zur Kraularmbewegung. Gött<strong>in</strong>gen.<br />
285


