

Biomechanics and Medicine in Swimming XI
Biomechanics and Medicine in Swimming XI
Biomechanics and Medicine in Swimming XI

Create successful ePaper yourself
Turn your PDF publications into a flip-book with our unique Google optimized e-Paper software.
was calculated for each year <strong>and</strong> averaged with<strong>in</strong> each event. This number<br />
was used to estimate the st<strong>and</strong>ard deviation of the predicted time for<br />
each event us<strong>in</strong>g the formula 1.25*(mean percent difference)*(predicted<br />
value)/100. This st<strong>and</strong>ard deviation was used to establish the 95% confidence<br />
<strong>in</strong>terval for that event (predicted time ± 2 st<strong>and</strong>ard deviations).<br />
The mean time of the f<strong>in</strong>alists of the 2008 Olympics were compared to<br />
this 95% confidence <strong>in</strong>terval <strong>and</strong> actual times that fall outside the <strong>in</strong>terval<br />
were concluded to be significantly faster or slower than predicted.<br />
To exam<strong>in</strong>e each Olympic year as a whole, a count was made of the<br />
number of events for which the actual time was above or below the correspond<strong>in</strong>g<br />
prediction curve. A b<strong>in</strong>omial test of statistical significance<br />
was used to test whether or not the likelihood of the number of events<br />
be<strong>in</strong>g either faster or slower than our predictions was different than<br />
50%. This table of event counts was tested to determ<strong>in</strong>e whether or not a<br />
particular year was faster or slower, <strong>in</strong> general, than predicted.<br />
To test the repeatability of this prediction method, the same calculations<br />
were performed to compare actual versus predicted performances of<br />
the 2004 Games us<strong>in</strong>g data from 1972 through 2000 only. These procedures<br />
were repeated for all Olympic Games 1988-2000 (us<strong>in</strong>g data s<strong>in</strong>ce 1972).<br />
results<br />
Prediction Analysis: For the 2008 Olympic Games, 10/13 (77%) men’s<br />
<strong>and</strong> 7/13 (54%) women’s events recorded mean times for the eight f<strong>in</strong>alists<br />
that were significantly faster than the predicted outcome values.<br />
Only 34% of the events <strong>in</strong> the 2008 Games were successfully predicted.<br />
Between 1988 <strong>and</strong> 2004, 10/61 (16%) men’s events were significantly<br />
faster <strong>and</strong> 1 (2%) event was significantly slower than predicted. For the<br />
women, 1/61 (2%) events was significantly faster <strong>and</strong> 9 (15%) events<br />
were significantly slower than predicted. That is, 87% of all events were<br />
successfully predicted. These data are presented <strong>in</strong> Table 1 <strong>and</strong> Figure 2.<br />
Table 1. Comparisons between predicted <strong>and</strong> actual Olympic f<strong>in</strong>al performance<br />
for all men’s events from 2000, 2004, <strong>and</strong> 2008. Predictions were<br />
based on the mean of top 8 performances for each event beg<strong>in</strong>n<strong>in</strong>g <strong>in</strong> 1972<br />
up to the Olympics prior. For example, to predict the 100 Free <strong>in</strong> 2000, top<br />
8 means from 1972, ’76, ’80, ’84, ’88, ’92, <strong>and</strong> ’96 were plotted <strong>and</strong> regressed<br />
us<strong>in</strong>g a power function. † denotes significantly faster than predicted.<br />
2000 2004 2008<br />
Men's Predicted Actual ƀ<br />
Act-Pred Predicted Actual ƀ<br />
Act-Pred Predicted Actual ƀ<br />
Act-Pred<br />
Event Mean (s) Mean (s) (S.D.) Mean (s) Mean (s) (S.D.) Mean (s) Mean (s) (S.D.)<br />
50 Free 22.28 22.19 0.85 22.10 22.11 -0.12 22.00 21.57 5.46†<br />
100 Free 49.28 48.95 1.17 49.00 48.80 0.74 48.79 47.77 3.36†<br />
200 Free 107.58 107.43 0.19 107.13 106.49 0.96 106.61 105.81 1.23<br />
400 Free 227.10 226.21 0.59 225.90 225.92 -0.01 225.09 223.72 1.13<br />
1500 Free 899.22 901.67 -0.26 896.68 898.05 -0.16 894.18 888.61 0.63<br />
100 Back 55.03 54.85 0.39 54.76 54.52 0.57 54.50 53.28 3.04†<br />
200 Back 119.79 118.43 1.75 118.97 117.98 1.17 118.31 115.54 3.44†<br />
100 Breast 61.47 61.25 0.66 61.14 61.15 -0.02 60.91 59.64 4.45†<br />
200 Breast 132.86 132.85 0.02 132.21 131.14 1.32 131.34 129.44 2.06†<br />
100 Fly 53.16 52.53 2.16† 52.77 51.98 2.41† 52.38 51.23 3.29†<br />
200 Fly 117.54 116.69 1.37 116.92 115.89 1.51 116.33 113.86 3.87†<br />
200 IM 121.26 121.13 0.42 120.74 119.71 3.55† 120.02 117.88 5.46†<br />
400 IM 255.79 256.74 -1.49 255.00 254.71 0.42 253.99 250.54 5.45†<br />
% of Total Events<br />
Predictive Success Rate of All Olympic Events (1988-2008)<br />
100<br />
90<br />
80<br />
70<br />
Men<br />
60<br />
Women<br />
50<br />
Comb<strong>in</strong>ed M & W<br />
40<br />
30<br />
20<br />
1988 1992 1996 2000 2004 2008<br />
Figure 2. Percent of total events successfully predicted (with<strong>in</strong> 95% C.I.)<br />
for each Olympic Games (1988-2008) for men, women, <strong>and</strong> comb<strong>in</strong>ed<br />
men <strong>and</strong> women categories.<br />
chaPter4.tra<strong>in</strong><strong>in</strong>g<strong>and</strong>Performance<br />
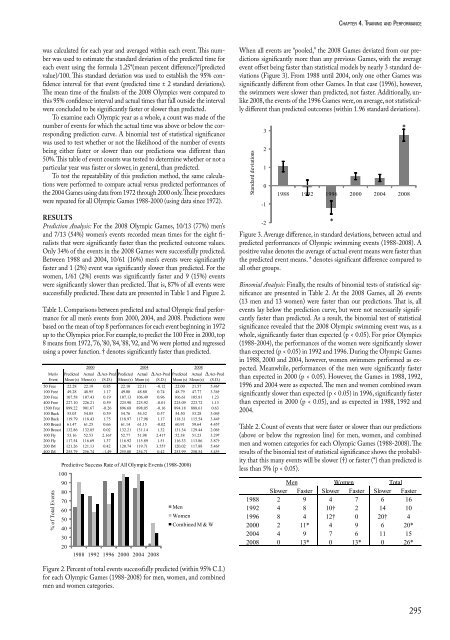
When all events are “pooled,” the 2008 Games deviated from our predictions<br />
significantly more than any previous Games, with the average<br />
event offset be<strong>in</strong>g faster than statistical models by nearly 3 st<strong>and</strong>ard deviations<br />
(Figure 3). From 1988 until 2004, only one other Games was<br />
significantly different from other Games. In that case (1996), however,<br />
the swimmers were slower than predicted, not faster. Additionally, unlike<br />
2008, the events of the 1996 Games were, on average, not statistically<br />
different than predicted outcomes (with<strong>in</strong> 1.96 st<strong>and</strong>ard deviations).<br />
St<strong>and</strong>ard deviations<br />
3<br />
2<br />
1<br />
0<br />
-1<br />
1988 1992 1996 2000 2004 2008<br />
*<br />
-2<br />
Figure 3. Average difference, <strong>in</strong> st<strong>and</strong>ard deviations, between actual <strong>and</strong><br />
predicted performances of Olympic swimm<strong>in</strong>g events (1988-2008). A<br />
positive value denotes the average of actual event means were faster than<br />
the predicted event means. * denotes significant difference compared to<br />
all other groups.<br />
B<strong>in</strong>omial Analysis: F<strong>in</strong>ally, the results of b<strong>in</strong>omial tests of statistical significance<br />
are presented <strong>in</strong> Table 2. At the 2008 Games, all 26 events<br />
(13 men <strong>and</strong> 13 women) were faster than our predictions. That is, all<br />
events lay below the prediction curve, but were not necessarily significantly<br />
faster than predicted. As a result, the b<strong>in</strong>omial test of statistical<br />
significance revealed that the 2008 Olympic swimm<strong>in</strong>g event was, as a<br />
whole, significantly faster than expected (p < 0.05). For prior Olympics<br />
(1988-2004), the performances of the women were significantly slower<br />
than expected (p < 0.05) <strong>in</strong> 1992 <strong>and</strong> 1996. Dur<strong>in</strong>g the Olympic Games<br />
<strong>in</strong> 1988, 2000 <strong>and</strong> 2004, however, women swimmers performed as expected.<br />
Meanwhile, performances of the men were significantly faster<br />
than expected <strong>in</strong> 2000 (p < 0.05). However, the Games <strong>in</strong> 1988, 1992,<br />
1996 <strong>and</strong> 2004 were as expected. The men <strong>and</strong> women comb<strong>in</strong>ed swam<br />
significantly slower than expected (p < 0.05) <strong>in</strong> 1996, significantly faster<br />
than expected <strong>in</strong> 2000 (p < 0.05), <strong>and</strong> as expected <strong>in</strong> 1988, 1992 <strong>and</strong><br />
2004.<br />
Table 2. Count of events that were faster or slower than our predictions<br />
(above or below the regression l<strong>in</strong>e) for men, women, <strong>and</strong> comb<strong>in</strong>ed<br />
men <strong>and</strong> women categories for each Olympic Games (1988-2008). The<br />
results of the b<strong>in</strong>omial test of statistical significance shows the probability<br />
that this many events will be slower (†) or faster (*) than predicted is<br />
less than 5% (p < 0.05).<br />
Men Women Total<br />
Slower Faster Slower Faster Slower Faster<br />
1988 2 9 4 7 6 16<br />
1992 4 8 10† 2 14 10<br />
1996 8 4 12† 0 20† 4<br />
2000 2 11* 4 9 6 20*<br />
2004 4 9 7 6 11 15<br />
2008 0 13* 0 13* 0 26*<br />
*<br />
295


