

Biomechanics and Medicine in Swimming XI
Biomechanics and Medicine in Swimming XI
Biomechanics and Medicine in Swimming XI

Create successful ePaper yourself
Turn your PDF publications into a flip-book with our unique Google optimized e-Paper software.
<strong>Biomechanics</strong><strong>and</strong>medic<strong>in</strong>e<strong>in</strong>swimm<strong>in</strong>gXi<br />
(Dopsaj et al., 2000; Dopsaj et al., 2003). The 2000 N load cell had 4<br />
attached stra<strong>in</strong> gauges <strong>and</strong> an accuracy of 30 g. One of its extremities<br />
was fixed to a special designed support, attached to the start<strong>in</strong>g platform<br />
or to the pool border, while the other was connected to an <strong>in</strong>extensible<br />
cable, <strong>in</strong> which swimmer was tethered. Mechanical deformations <strong>in</strong> the<br />
load cell, generated by swimmer’s efforts, were recognized by an A/D<br />
<strong>in</strong>terface, which converted the analogue voltage <strong>in</strong> a digital signal. In<br />
sequence, the force values were obta<strong>in</strong>ed through the calibration straight<br />
l<strong>in</strong>e. The m<strong>in</strong>or acquisition frequency used was 200 Hz. Raw data was<br />
low-pass filtered with a cut-off frequency of 8 Hz. The system was calibrated<br />
us<strong>in</strong>g <strong>in</strong>crements of 5 Kg until the maximum weight of 50 Kg.<br />
It was checked before every test<strong>in</strong>g session us<strong>in</strong>g a weight of 10 Kg.<br />
As warm-up, swimmers performed a 10-m<strong>in</strong>ute active stretch <strong>and</strong> 15<br />
m<strong>in</strong>utes of free swimm<strong>in</strong>g. After, a specific procedure described earlier<br />
(Dopsaj et al., 2000) was conducted <strong>in</strong> order to get swimmers familiarized<br />
with the equipment.<br />
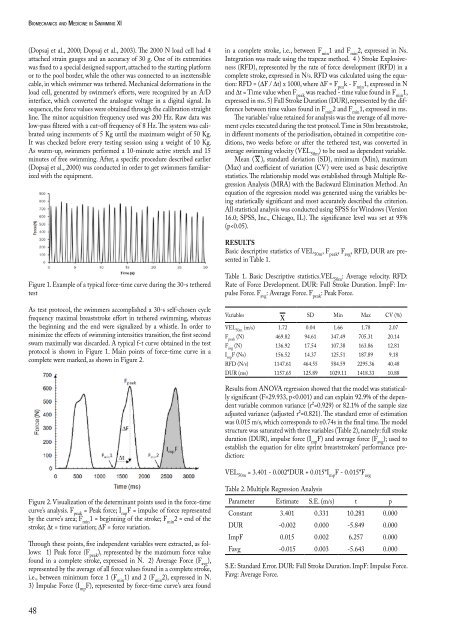
Figure 1. Example of a typical force-time curve dur<strong>in</strong>g the 30-s tethered<br />
test<br />
As test protocol, the swimmers accomplished a 30-s self-chosen cycle<br />
frequency maximal breaststroke effort <strong>in</strong> tethered swimm<strong>in</strong>g, whereas<br />
the beg<strong>in</strong>n<strong>in</strong>g <strong>and</strong> the end were signalized by a whistle. In order to<br />
m<strong>in</strong>imize the effects of swimm<strong>in</strong>g <strong>in</strong>tensities transition, the first second<br />
swam maximally was discarded. A typical f-t curve obta<strong>in</strong>ed <strong>in</strong> the test<br />
protocol is shown <strong>in</strong> Figure 1. Ma<strong>in</strong> po<strong>in</strong>ts of force-time curve <strong>in</strong> a<br />
complete were marked, as shown <strong>in</strong> Figure 2.<br />
Figure 2. Visualization of the determ<strong>in</strong>ant po<strong>in</strong>ts used <strong>in</strong> the force-time<br />
curve’s analysis. F peak = Peak force; I mp F = impulse of force represented<br />
by the curve’s area; F m<strong>in</strong> 1 = beg<strong>in</strong>n<strong>in</strong>g of the stroke; F m<strong>in</strong> 2 = end of the<br />
stroke; ∆t = time variation; ∆F = force variation.<br />
Through these po<strong>in</strong>ts, five <strong>in</strong>dependent variables were extracted, as follows:<br />
1) Peak force (F peak ), represented by the maximum force value<br />
found <strong>in</strong> a complete stroke, expressed <strong>in</strong> N. 2) Average Force (F avg ),<br />
represented by the average of all force values found <strong>in</strong> a complete stroke,<br />
i.e., between m<strong>in</strong>imum force 1 (F m<strong>in</strong> 1) <strong>and</strong> 2 (F m<strong>in</strong> 2), expressed <strong>in</strong> N.<br />
3) Impulse Force (I mp F), represented by force-time curve’s area found<br />
48<br />
<strong>in</strong> a complete stroke, i.e., between F m<strong>in</strong> 1 <strong>and</strong> F m<strong>in</strong> 2, expressed <strong>in</strong> Ns.<br />
Integration was made us<strong>in</strong>g the trapeze method. 4 ) Stroke Explosiveness<br />
(RFD), represented by the rate of force development (RFD) <strong>in</strong> a<br />
complete stroke, expressed <strong>in</strong> N/s. RFD was calculated us<strong>in</strong>g the equation:<br />
RFD = (∆F / ∆t) x 1000, where ∆F = F pea k - F m<strong>in</strong> 1, expressed <strong>in</strong> N<br />
<strong>and</strong> ∆t = Time value when F peak was reached - time value found <strong>in</strong> F m<strong>in</strong> 1,<br />
expressed <strong>in</strong> ms. 5) Full Stroke Duration (DUR), represented by the difference<br />
between time values found <strong>in</strong> F m<strong>in</strong> 2 <strong>and</strong> F m<strong>in</strong> 1, expressed <strong>in</strong> ms.<br />
The variables’ value reta<strong>in</strong>ed for analysis was the average of all movement<br />
cycles executed dur<strong>in</strong>g the test protocol. Time <strong>in</strong> 50m breaststroke,<br />
<strong>in</strong> different moments of the periodisation, obta<strong>in</strong>ed <strong>in</strong> competitive conditions,<br />
two weeks before or after the tethered test, was converted <strong>in</strong><br />
average swimm<strong>in</strong>g velocity (VEL 50m ) to be used as dependent variable.<br />
Mean ( Χ ), st<strong>and</strong>ard deviation (SD), m<strong>in</strong>imum (M<strong>in</strong>), maximum<br />
(Max) <strong>and</strong> coefficient of variation (CV) were used as basic descriptive<br />
statistics. The relationship model was established through Multiple Regression<br />
Analysis (MRA) with the Backward Elim<strong>in</strong>ation Method. An<br />
equation of the regression model was generated us<strong>in</strong>g the variables be<strong>in</strong>g<br />
statistically significant <strong>and</strong> most accurately described the criterion.<br />
All statistical analysis was conducted us<strong>in</strong>g SPSS for W<strong>in</strong>dows (Version<br />
16.0; SPSS, Inc., Chicago, IL). The significance level was set at 95%<br />
(p


