

Biomechanics and Medicine in Swimming XI
Biomechanics and Medicine in Swimming XI
Biomechanics and Medicine in Swimming XI

Create successful ePaper yourself
Turn your PDF publications into a flip-book with our unique Google optimized e-Paper software.
etween experimental groups <strong>and</strong> control for TC (P ≤ 0.05) (Figure 1) . (Control Group<br />
35.9; Cycl<strong>in</strong>g Group (CG) = 154.93 ± 36 vs. 140.03 ± 21.8; Runn<strong>in</strong>g Group (RG) =<br />
= 155.78 ± 35.3 vs. 157.35 ± 35.4, Swimm<strong>in</strong>g Group (SG) = 155.76 ± 33 vs. 136.41<br />
Figure<br />
±<br />
4). (Control Group: = 40.2 ± 17.8 vs. 39.98 ± 15.4; SG =; 40.33 ± 7.9 vs.<br />
156.34 ± 34.7 vs. 139.25 ± 35.8). Total Cholesterol <strong>in</strong> three groups decreased; SG:<br />
35.9; Cycl<strong>in</strong>g Group (CG) = 154.93 ± 36 vs. 140.03 ± 21.8; Runn<strong>in</strong>g Group (RG) 50.01±8.4; = CG = 40.46 ± 3.5 vs. 48.40 ± 3.2; RG = 42.84 ± 6.1 vs. 51.14 ± 9.6). HDL-c<br />
12.42%, CG: 9.61%, RG: 10.93%. Comparison with Tukey test showed that no<br />
<strong>Biomechanics</strong><strong>and</strong>medic<strong>in</strong>e<strong>in</strong>swimm<strong>in</strong>gXi<br />
156.34 ± 34.7 vs. 139.25 ± 35.8). Total Cholesterol <strong>in</strong> three groups decreased; SG: <strong>in</strong>creased: SG: 24.00%, CG: 19.62%, RG: 19.37%). Comparison with Tukey test<br />
significant<br />
12.42%, CG:<br />
differences<br />
9.61%,<br />
between<br />
RG: 10.93%.<br />
Control<br />
Comparison<br />
Group <strong>and</strong><br />
with<br />
CG (p<br />
Tukey<br />
= 0.530)<br />
test<br />
so<br />
showed<br />
RG (p=<br />
that<br />
0.317);<br />
no showed that no significant differences between Control Group <strong>and</strong> CG (p = 0.217) so<br />
but<br />
significant<br />
there were<br />
differences<br />
significant<br />
between<br />
differences<br />
Control<br />
between<br />
Group<br />
control<br />
<strong>and</strong> CG<br />
group<br />
(p = 0.530)<br />
<strong>and</strong> SG<br />
so<br />
(p<br />
RG<br />
= 0.012).<br />
(p= 0.317); RG (p= 0.191); but there were differences between control group <strong>and</strong> SG (p = 0.010).<br />
but there were significant differences between control group <strong>and</strong> SG (p = 0.012).<br />
TC content<br />
HDL-c Content<br />
mg/dl<br />
mg/dl<br />
250<br />
200 250<br />
150 200<br />
100 150<br />
100 50<br />
TC content<br />
1 WK<br />
1 16 WKWk<br />
16 Wk<br />
80<br />
mg/dl 60<br />
40<br />
20<br />
1 WK<br />
16 Wk<br />
50 0<br />
0<br />
0 Control Swimm<strong>in</strong>g Cycl<strong>in</strong>g Runn<strong>in</strong>g<br />
Control Swimm<strong>in</strong>g Cycl<strong>in</strong>g Runn<strong>in</strong>g<br />
Control Swimm<strong>in</strong>g Cycl<strong>in</strong>g Runn<strong>in</strong>g<br />
Figure 1. 1. Comparison the the effect effect of swimm<strong>in</strong>g, of swimm<strong>in</strong>g, cycl<strong>in</strong>g cycl<strong>in</strong>g on subject’s on subject’s TC. TC.<br />
Figure 1. Comparison the effect of swimm<strong>in</strong>g, cycl<strong>in</strong>g on subject’s TC.<br />
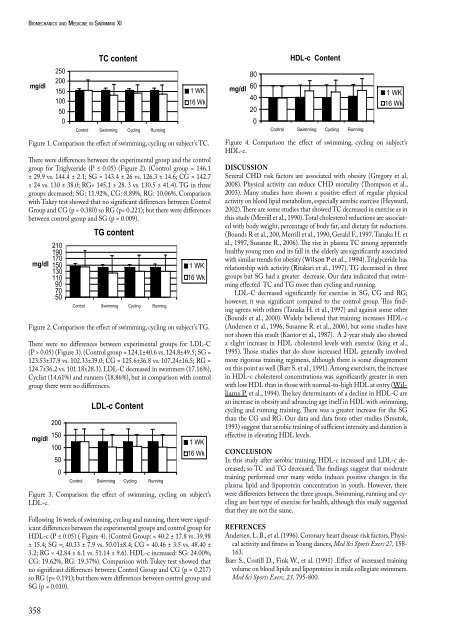
Figure 4. 4. Comparison the the effect effect of swimm<strong>in</strong>g, of swimm<strong>in</strong>g, cycl<strong>in</strong>g cycl<strong>in</strong>g on subject’s on subject’s HDL-c.<br />
HDL-c.<br />
There were differences between the experimental group <strong>and</strong> <strong>and</strong> the the control group DISCUSSION<br />
for<br />
Triglyceride group<br />
There were<br />
for Triglyceride (P differences ≤ 0.05) (Figure between<br />
(P ≤ 2). 0.05)<br />
the (Control experimental<br />
(Figure group 2). = (Control<br />
group 146.1 ± <strong>and</strong> 29.9 group<br />
the vs. control<br />
= 144.4 146.1<br />
group ± 2.1; SG for Several dIscussIon<br />
= CHD risk factors are associated with obesity (Gregory et al, 2008). Physical<br />
143.4 ±<br />
Triglyceride<br />
29.9 ± 26 vs. vs. 144.4<br />
(P 126.3 ≤ 0.05)<br />
± 2.1; ± (Figure 14.6; SG CG =<br />
2).<br />
143.4 = (Control 142.7 ± 26 ± group 24 vs. vs. 126.3<br />
= 146.1 130 ± ±<br />
14.6; 38.0; 29.9<br />
CG<br />
vs. RG= 144.4<br />
= 145.1 142.7<br />
± 2.1; ± 28. SG 3 activity Several = vs. can CHD reduce risk CHD factors mortality are associated (Thompson with et obesity al., 2003). (Gregory Many et studies al, have shown a<br />
130.5 143.4<br />
± 24 ±<br />
vs. 41.4). 26 vs.<br />
130 ± TG 126.3<br />
38.0; <strong>in</strong> ± three 14.6;<br />
RG= groups CG = 142.7<br />
145.1 decreased; ± 24<br />
± 28. 3 vs. SG: vs. 130<br />
130.5 11.92%, ± 38.0;<br />
± 41.4). CG: RG=<br />
TG 8.89%, 145.1<br />
<strong>in</strong> three RG: ± 28. 10.06%. 3 vs.<br />
positive 2008). Physical effect of activity regular can physical reduce activity CHD on mortality blood lipid (Thompson metabolism, et al., especially aerobic<br />
Comparison 130.5 ± 41.4).<br />
groups decreased;<br />
with TG Tukey <strong>in</strong> three<br />
SG:<br />
test groups<br />
11.92%,<br />
showed decreased;<br />
CG:<br />
that<br />
8.89%,<br />
no SG: significant 11.92%,<br />
RG: 10.06%.<br />
differences CG: 8.89%,<br />
Comparison<br />
between RG: 10.06%. Control exercise 2003). Many (Heyward, studies 2002). have There shown are a some positive studies effect that of showed regular TC physical decreased <strong>in</strong> exercise<br />
Group Comparison<br />
with Tukey<br />
<strong>and</strong> CG with<br />
test<br />
(p Tukey<br />
showed<br />
= 0.380) test<br />
that<br />
so showed<br />
no<br />
RG<br />
significant<br />
(p= that 0.221); no significant<br />
differences<br />
but there differences<br />
between<br />
were differences between Control<br />
Control<br />
between<br />
control Group<br />
Group<br />
group <strong>and</strong> CG<br />
<strong>and</strong> CG<br />
<strong>and</strong> (p<br />
(p<br />
SG =<br />
=<br />
(p 0.380)<br />
0.380)<br />
= 0.009). so RG (p= 0.221); but there were differences between<br />
as activity <strong>in</strong> this on study blood (Merrill lipid metabolism, et al., 1990). especially Total aerobic cholesterol exercise reductions (Heyward, are associated with<br />
control group <strong>and</strong> SG (p = 0.009). so RG (p= 0.221); but there were differences body 2002). weight, There are percentage some studies of body that fat, showed <strong>and</strong> TC dietary decreased fat reductions. <strong>in</strong> exercise (Bounds as <strong>in</strong> R et al., 200,<br />
between control group <strong>and</strong> SG (p = 0.009).<br />
Merrill this study et al., (Merrill 1990, et Gerald al., 1990). F., 1997. Total Tanaka cholesterol H. et reductions al., 1997, are Susanne associat- R., 2006). The rise<br />
TG content<br />
TG content<br />
210<br />
190 210<br />
170 190<br />
mg/dl 150 170<br />
mg/dl 1 WK<br />
130 150<br />
1 WK<br />
110 130<br />
16 Wk<br />
110 90<br />
16 Wk<br />
70<br />
90<br />
50 70<br />
50<br />
Control Swimm<strong>in</strong>g Cycl<strong>in</strong>g Runn<strong>in</strong>g<br />
Control Swimm<strong>in</strong>g Cycl<strong>in</strong>g Runn<strong>in</strong>g<br />
Figure Figure 2. 2. Comparison Comparison the effect of of swimm<strong>in</strong>g, swimm<strong>in</strong>g, cycl<strong>in</strong>g cycl<strong>in</strong>g on on subject’s subject’s TG. TG.<br />
BMS Figure <strong>XI</strong> 2. Comparison Chapter the effect 6. <strong>Medic<strong>in</strong>e</strong>, of swimm<strong>in</strong>g, Rehabilitation cycl<strong>in</strong>g <strong>and</strong> Prevention on subject’s TG.<br />
ed with body weight, percentage of body fat, <strong>and</strong> dietary fat reductions.<br />
(Bounds R et al., 200, Merrill et al., 1990, Gerald F., 1997. Tanaka H. et<br />
al., 1997, Susanne R., 2006). The rise <strong>in</strong> plasma TC among apparently<br />
healthy young men <strong>and</strong> its fall <strong>in</strong> the elderly are significantly associated<br />
with similar trends for obesity (Wilson P et al., 1994). Triglyceride has<br />
relationship with activity (Ritakari et al., 1997). TG decreased <strong>in</strong> three<br />
groups but SG had a greater decrease. Our data <strong>in</strong>dicated that swimm<strong>in</strong>g<br />
effected TC <strong>and</strong> TG more than cycl<strong>in</strong>g <strong>and</strong> runn<strong>in</strong>g.<br />
LDL-C decreased significantly for exercise <strong>in</strong> SG, CG <strong>and</strong> RG;<br />
however, it was significant compared to the control group. This f<strong>in</strong>d<strong>in</strong>g<br />
agrees with others (Tanaka H. et al., 1997) <strong>and</strong> aga<strong>in</strong>st some other<br />
(Bounds et al., 2000). Widely believed that tra<strong>in</strong><strong>in</strong>g <strong>in</strong>creases HDL-c<br />
13<br />
(Andersen et al., 1996, Susanne R. et al., 2006), but some studies have<br />
not shown this result (Kantor et al., 1987). A 2-year study also showed<br />
There were no differences between experimental groups for LDL-C a slight <strong>in</strong>crease <strong>in</strong> HDL cholesterol levels with exercise (k<strong>in</strong>g et al.,<br />
There (P > 0.05) were (Figure no 3). differences (Control group between = 124.1±40.6 experimental vs. 124.8±49.5; groups SG = for LDL-C 1995). Those studies that do show <strong>in</strong>creased HDL generally <strong>in</strong>volved<br />
(P 123.53±37.9 > 0.05) (Figure vs. 102.33±39.0; 3). (Control group CG = = 125.6±36.8 124.1±40.6 vs. vs. 107.24±16.5; 124.8±49.5; SG RG = 123.53±37.9 more rigorous tra<strong>in</strong><strong>in</strong>g regimens, although there is some disagreement<br />
vs. 124.7±36.2 102.33±39.0; vs. 101.18±28.3). CG = 125.6±36.8 LDL-C decreased vs. 107.24±16.5; <strong>in</strong> swimmers RG (17.16%), = 124.7±36.2 on this vs. po<strong>in</strong>t as well (Barr S. et al., 1991). Among exercisers, the <strong>in</strong>crease<br />
101.18±28.3). Cyclist (14.61%) LDL-C <strong>and</strong> decreased runners (18.86%), <strong>in</strong> swimmers but <strong>in</strong> (17.16%), comparison Cyclist with (14.61%) control <strong>and</strong> runners <strong>in</strong> HDL-c cholesterol concentrations was significantly greater <strong>in</strong> men<br />
(18.86%), group there but were <strong>in</strong> comparison no differences. with control group there were no differences. with low HDL than <strong>in</strong> those with normal-to-high HDL at entry (Williams<br />
P. et al., 1994). The key determ<strong>in</strong>ants of a decl<strong>in</strong>e <strong>in</strong> HDL-C are<br />
LDL-c Content<br />
an <strong>in</strong>crease <strong>in</strong> obesity <strong>and</strong> advanc<strong>in</strong>g age itself <strong>in</strong> HDL with swimm<strong>in</strong>g,<br />
cycl<strong>in</strong>g <strong>and</strong> runn<strong>in</strong>g tra<strong>in</strong><strong>in</strong>g. There was a greater <strong>in</strong>crease for the SG<br />
200<br />
than the CG <strong>and</strong> RG. Our data <strong>and</strong> data from other studies (Smutok,<br />
1993) suggest that aerobic tra<strong>in</strong><strong>in</strong>g of sufficient <strong>in</strong>tensity <strong>and</strong> duration is<br />
150<br />
mg/dl<br />
100<br />
50<br />
1 WK<br />
16 Wk<br />
effective <strong>in</strong> elevat<strong>in</strong>g HDL levels.<br />
conclusIon<br />
In this study after aerobic tra<strong>in</strong><strong>in</strong>g, HDL-c <strong>in</strong>creased <strong>and</strong> LDL-c de-<br />
0<br />
Control Swimm<strong>in</strong>g Cycl<strong>in</strong>g Runn<strong>in</strong>g<br />
creased; so TC <strong>and</strong> TG decreased. The f<strong>in</strong>d<strong>in</strong>gs suggest that moderate<br />
tra<strong>in</strong><strong>in</strong>g performed over many weeks <strong>in</strong>duces positive changes <strong>in</strong> the<br />
plasma lipid <strong>and</strong> lipoprote<strong>in</strong> concentration <strong>in</strong> youth. However, there<br />
Figure 3. 3. Comparison the effect the effect of swimm<strong>in</strong>g, of swimm<strong>in</strong>g, cycl<strong>in</strong>g cycl<strong>in</strong>g on subject’s on subject’s LDL-c. were differences between the three groups. Swimm<strong>in</strong>g, runn<strong>in</strong>g <strong>and</strong> cy-<br />
LDL-c.<br />
cl<strong>in</strong>g are best type of exercise for health, although this study suggested<br />
Follow<strong>in</strong>g 16 week of swimm<strong>in</strong>g, cycl<strong>in</strong>g <strong>and</strong> runn<strong>in</strong>g, there were significant that they are not the same.<br />
differences<br />
Follow<strong>in</strong>g 16<br />
between<br />
week of<br />
the<br />
swimm<strong>in</strong>g,<br />
experimental<br />
cycl<strong>in</strong>g<br />
groups<br />
<strong>and</strong><br />
<strong>and</strong><br />
runn<strong>in</strong>g,<br />
control<br />
there<br />
group<br />
were<br />
for HDL-c<br />
signif-<br />
(P ≤ 0.05) (<br />
Figure<br />
icant differences<br />
4). (Control<br />
between<br />
Group:<br />
the<br />
=<br />
experimental<br />
40.2 ± 17.8 vs.<br />
groups<br />
39.98<br />
<strong>and</strong><br />
±<br />
control<br />
15.4; SG<br />
group<br />
=; 40.33<br />
for<br />
± 7.9 reFrences<br />
vs.<br />
50.01±8.4;<br />
HDL-c (P<br />
CG<br />
≤ 0.05)<br />
= 40.46<br />
( Figure<br />
± 3.5 vs.<br />
4).<br />
48.40<br />
(Control<br />
± 3.2;<br />
Group:<br />
RG =<br />
=<br />
42.84<br />
40.2<br />
±<br />
6.1<br />
17.8<br />
vs.<br />
vs.<br />
51.14<br />
39.98<br />
± 9.6). HDL-c Andersen. L. B., et al. (1996). Coronary heart disease risk factors, Physi-<br />
<strong>in</strong>creased: SG: 24.00%, CG: 19.62%, RG: 19.37%). Comparison with Tukey test<br />
± 15.4; SG =; 40.33 ± 7.9 vs. 50.01±8.4; CG = 40.46 ± 3.5 vs. 48.40 ± cal activity <strong>and</strong> fitness <strong>in</strong> Young dances, Med Sci Sports Exerc 27, 158showed<br />
that no significant differences between Control Group <strong>and</strong> CG (p = 0.217) so<br />
3.2; RG = 42.84 ± 6.1 vs. 51.14 ± 9.6). HDL-c <strong>in</strong>creased: SG: 24.00%, 163.<br />
RG (p= 0.191); but there were differences between control group <strong>and</strong> SG (p = 0.010).<br />
CG: 19.62%, RG: 19.37%). Comparison with Tukey test showed that Barr S., Costill D., F<strong>in</strong>k W., et al. (1991) .Effect of <strong>in</strong>creased tra<strong>in</strong><strong>in</strong>g<br />
no significant differences between Control Group <strong>and</strong> CG (p = 0.217) volume on blood lipids <strong>and</strong> lipoprote<strong>in</strong>s <strong>in</strong> male collegiate swimmers.<br />
so RG (p= 0.191); but there HDL-c were Content differences between control group <strong>and</strong><br />
SG (p = 0.010).<br />
80<br />
Med Sci Sports Exerc, 23, 795-800.<br />
mg/dl 60<br />
358 40<br />
20<br />
0<br />
1 WK<br />
16 Wk


