

Biomechanics and Medicine in Swimming XI
Biomechanics and Medicine in Swimming XI
Biomechanics and Medicine in Swimming XI

Create successful ePaper yourself
Turn your PDF publications into a flip-book with our unique Google optimized e-Paper software.
% anaerobic capacity; thus for elite swimmers mean tra<strong>in</strong><strong>in</strong>g <strong>in</strong>tensity<br />
is the determ<strong>in</strong><strong>in</strong>g component of enhanced performance <strong>and</strong> not volume<br />
or frequency (which might be different <strong>in</strong> age group swimmers). In<br />
addition it was shown that swimmers who improved their performace<br />
significantly <strong>in</strong> a season were primarily those who managed to swim the<br />
first races of a new season at relatively higher speed (<strong>in</strong> % of their personal<br />
best). Concern<strong>in</strong>g high <strong>in</strong>tensity tra<strong>in</strong><strong>in</strong>g regimes, costill, Kovaleski,<br />
Porter, Kirwan, Field<strong>in</strong>g, K<strong>in</strong>g published already <strong>in</strong> 1985 that elite<br />
athletes might possess a stimulus threshold requir<strong>in</strong>g HIT conditions,<br />
result<strong>in</strong>g <strong>in</strong> higher power output <strong>and</strong> faster race times.<br />
The coach also decided to consider this activity as a psycho-physical<br />
issue. An activity is a necessary condition which is modulated by personal<br />
traits result<strong>in</strong>g <strong>in</strong> an <strong>in</strong>ternal fatigu<strong>in</strong>g impulse (Mujika, Busso,<br />
Geyssant, Chatard, Barale, Lacoste, 1996) <strong>and</strong> becomes the sufficient<br />
determ<strong>in</strong><strong>in</strong>g condition for biological adaptation. Ulmer (1986) po<strong>in</strong>ted<br />
out that delayed stress triggers adaptation on the cellular level caus<strong>in</strong>g<br />
changes <strong>in</strong> biological mass, like mitochondria, enzymes, vessels, <strong>in</strong>clud<strong>in</strong>g<br />
energy delivery or power systems us<strong>in</strong>g exist<strong>in</strong>g genetical pathways.<br />
The effect of the daily tra<strong>in</strong><strong>in</strong>g rout<strong>in</strong>es must not be separated from<br />
the daily <strong>in</strong>duced stress of everyday life circumstances, like amount of<br />
sleep or psychological stress may <strong>in</strong>dividually <strong>in</strong>fluence <strong>in</strong>ternal thresholds<br />
related to effects of the fatigu<strong>in</strong>g impulse. It was decided to separate<br />
tra<strong>in</strong><strong>in</strong>g load (stra<strong>in</strong>) from <strong>in</strong>dividually perceived effects (stress) <strong>and</strong> to<br />
monitor both aspects for tra<strong>in</strong><strong>in</strong>g steer<strong>in</strong>g purpose (the say<strong>in</strong>g “no pa<strong>in</strong><br />
no ga<strong>in</strong>” can be understood as the importance of the <strong>in</strong>dividual reaction<br />
because a given load is not felt to be pa<strong>in</strong>ful by all members of the<br />
squad). The stress level perceived by the athlete can be recorded us<strong>in</strong>g a<br />
def<strong>in</strong>ed scale.<br />
Tra<strong>in</strong><strong>in</strong>g documentation formats, used so far, were replaced by a<br />
more <strong>in</strong>telligent format <strong>in</strong>troduced by Mujika et. al. (1996), called MITS<br />
(mean <strong>in</strong>tensity of a tra<strong>in</strong><strong>in</strong>g season). MITS is an easy way to represent<br />
tra<strong>in</strong><strong>in</strong>g components - <strong>in</strong>tensity, volume <strong>and</strong> frequency - <strong>in</strong> a s<strong>in</strong>gle value<br />
<strong>in</strong>stead of data <strong>in</strong> abundance. Tra<strong>in</strong><strong>in</strong>g loads are dist<strong>in</strong>guished <strong>in</strong> five<br />
load<strong>in</strong>g zones which are characterized by established <strong>in</strong>tensity <strong>in</strong>dex.<br />
MITS is calculated by multiply<strong>in</strong>g the volume data <strong>and</strong> stress <strong>in</strong>dex,<br />
respectively, summm<strong>in</strong>g up the products – <strong>in</strong>clud<strong>in</strong>g a dryl<strong>and</strong> tra<strong>in</strong><strong>in</strong>g<br />
equivalent- <strong>and</strong> divid<strong>in</strong>g the sum by the total meter sum dur<strong>in</strong>g<br />
the tra<strong>in</strong><strong>in</strong>g period taken <strong>in</strong>to consideration. The dryl<strong>and</strong> equivalent was<br />
described by Mujika et al. (1996) “ … it was empirically considered that<br />
1 h of dryl<strong>and</strong> tra<strong>in</strong><strong>in</strong>g was equivalent to 1 km swum at <strong>in</strong>tensity I, 0.5<br />
km at <strong>in</strong>tensity IV <strong>and</strong> 0.5 km at <strong>in</strong>tensity V.” How MITS-level effects<br />
the organism is unknown <strong>in</strong> detail. However, each coach would appreciate<br />
when the number of <strong>in</strong>fluenc<strong>in</strong>g parameters –which are likely to be<br />
related to each other <strong>in</strong> a still unknown way- is reduced.<br />
The purpose of this case study is to report the MITS-values <strong>and</strong> the<br />
perceived delayed stress-values based on be<strong>in</strong>g fatigued.<br />
Methods<br />
This is a case study. An elite female swimmer of 14 years of regular tra<strong>in</strong><strong>in</strong>g<br />
experience <strong>and</strong> 1:10.57 for 100 m breaststroke gave her consent to<br />
document twice a day the perceived level of fatigue a) directly after the<br />
workouts <strong>and</strong> b) on the follow<strong>in</strong>g morn<strong>in</strong>g accord<strong>in</strong>g to an exhaustion<br />
scale. A stress scale was negotiated between coach <strong>and</strong> athlete before<br />
start<strong>in</strong>g the monitor<strong>in</strong>g period. The details were: totally refreshed = 1,<br />
recovered = 2 – 3, relaxed = 4 – 5, reposed = 6, flagged = 7, tired = 8 – 9,<br />
nerveless = 10 -11, exhausted = 12 – 13, sick = 14. The values of i) <strong>and</strong> ii)<br />
were substracted from each other. The difference between both perceived<br />
fatigue values was calculated <strong>and</strong> called delayed perceived fatigue.<br />
Over a period of 144 days MITS-values per day were calculated based<br />
on the recorded tra<strong>in</strong><strong>in</strong>g components; MITS-values are placed between<br />
1 <strong>and</strong> 3 <strong>and</strong> values near to 3 represent most stra<strong>in</strong><strong>in</strong>g situations (Mujika<br />
et al., 1996). Five <strong>in</strong>tensity zones were def<strong>in</strong>ed accord<strong>in</strong>g to blood lactate<br />
<strong>and</strong> comb<strong>in</strong>ed with stress <strong>in</strong>dex: I1: < 2 mmol/l � 1, I2: 4 mmol/l � 2,<br />
I3: 6 mmol/l � 3, I4: 10 mmol/l � 5, I5: spr<strong>in</strong>t � 8. The calculation of<br />
MITS as a representative stra<strong>in</strong> factor was as follows.<br />
chaPter4.tra<strong>in</strong><strong>in</strong>g<strong>and</strong>Performance<br />
1. multiply the distance swum per tra<strong>in</strong><strong>in</strong>g load zone times the appropriate<br />
stress factor<br />
2. convert dry l<strong>and</strong> tra<strong>in</strong><strong>in</strong>g duration <strong>in</strong>to stress factor (here a constant<br />
factor: 4.5)<br />
3. add (a) 1 + 2 <strong>and</strong> (b) total tra<strong>in</strong><strong>in</strong>g volume (km per day)<br />
4. divide (a) by (b) to get MITS-Values<br />
MITS = (n kmI1)*1 + (n kmI2)*2 + (n kmI3)*3 + (n kmI4)*5 + (n kmI5)*8 + 4.5)<br />
total km<br />
results<br />
The elite female swimmer improved her best time by 2.8 % after this<br />
macro cycle over a period of 144 days or 288 half days, respectively. In<br />
this case study data of the tra<strong>in</strong><strong>in</strong>g components were: tra<strong>in</strong><strong>in</strong>g volume<br />
= 605 km, tra<strong>in</strong><strong>in</strong>g frequency = 188 half days, dryl<strong>and</strong> tra<strong>in</strong><strong>in</strong>g = 552<br />
m<strong>in</strong> <strong>and</strong> 100 half days of rest. The mean distance / day was 3.2 km. The<br />
percentages of the total distance covered at each <strong>in</strong>tensity level were: I1<br />
= 13.07 %, I2 = 75.52 %, I3 = 6.38 %, I4 = 1.24 % <strong>and</strong> I5 = 3.80 %. The<br />
calculated MITS-value (mean <strong>in</strong>tensity of a tra<strong>in</strong><strong>in</strong>g season) was 2.01<br />
± 0.12 arbitrary units. For a macro cycle of 16 weeks the distribution of<br />
MITS-values per week is presented (Fig 1).<br />
MITS<br />
2,30<br />
2,10<br />
1,90<br />
1,70<br />
1,50<br />
1 2 3 4 5 6 7 8 9 10 11 12 13 14 15 16<br />
Weeks<br />
Fig 1 MITS (mean <strong>in</strong>tensity of a tra<strong>in</strong><strong>in</strong>g season) <strong>in</strong> arbitrary units<br />
over a period of 16 weeks; the stars <strong>in</strong>dicate competitions.<br />
The representation of weekly MITS- values show a trend towards somewhat<br />
more <strong>in</strong>tensive tra<strong>in</strong><strong>in</strong>g loads.<br />
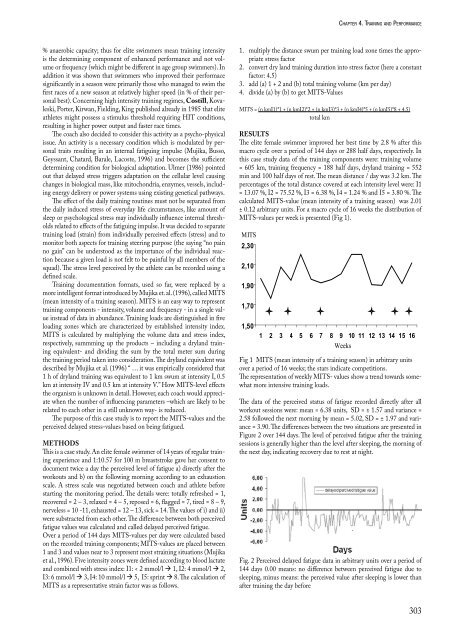
The data of the perceived status of fatigue recorded directly after all<br />
workout sessions were: mean = 6.38 units, SD = ± 1.57 <strong>and</strong> variance =<br />
2.58 followed the next morn<strong>in</strong>g by mean = 5.02, SD = ± 1.97 <strong>and</strong> variance<br />
= 3.90. The differences between the two situations are presented <strong>in</strong><br />
Figure 2 over 144 days. The level of perceived fatigue after the tra<strong>in</strong><strong>in</strong>g<br />
sessions is generally higher than the level after sleep<strong>in</strong>g, the morn<strong>in</strong>g of<br />
the next day, <strong>in</strong>dicat<strong>in</strong>g recovery due to rest at night.<br />
Fig. 2 Perceived delayed fatigue data <strong>in</strong> arbitrary units over a period of<br />
144 days 0.00 means: no difference between perceived fatigue due to<br />
sleep<strong>in</strong>g, m<strong>in</strong>us means: the perceived value after sleep<strong>in</strong>g is lower than<br />
after tra<strong>in</strong><strong>in</strong>g the day before<br />
303


