

Biomechanics and Medicine in Swimming XI
Biomechanics and Medicine in Swimming XI
Biomechanics and Medicine in Swimming XI

You also want an ePaper? Increase the reach of your titles
YUMPU automatically turns print PDFs into web optimized ePapers that Google loves.
<strong>Biomechanics</strong><strong>and</strong>medic<strong>in</strong>e<strong>in</strong>swimm<strong>in</strong>gXi<br />
Proportion of swimmers<br />
Proportion of swimmers<br />
268<br />
100%<br />
90%<br />
80%<br />
70%<br />
60%<br />
50%<br />
40%<br />
30%<br />
20%<br />
10%<br />
0%<br />
100%<br />
90%<br />
80%<br />
70%<br />
60%<br />
50%<br />
40%<br />
30%<br />
20%<br />
10%<br />
0%<br />
Girls<br />
1st 2nd 3rd 4th 5th 6th 7th 8th Total<br />
Place at f<strong>in</strong>als<br />
Boys<br />
1st 2nd 3rd 4th 5th 6th 7th 8th Total<br />
Place at F<strong>in</strong>als<br />
age 14<br />
age 15<br />
age 16<br />
age 17<br />
age 15<br />
age 16<br />
age 17<br />
age 18<br />
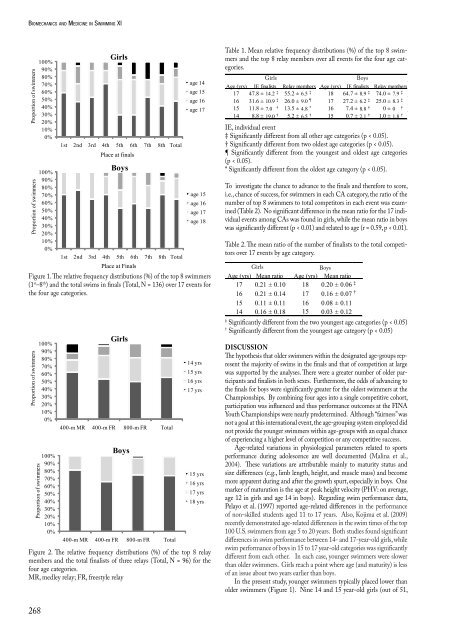
Figure 1. The relative frequency distributions (%) of the top 8 swimmers<br />
(1 st –8 th ) <strong>and</strong> the total swims <strong>in</strong> f<strong>in</strong>als (Total, N = 136) over 17 events for<br />
the four age categories.<br />
Proportion of swimmers<br />
Proportion of swimmers<br />
100%<br />
90%<br />
80%<br />
70%<br />
60%<br />
50%<br />
40%<br />
30%<br />
20%<br />
10%<br />
0%<br />
100%<br />
90%<br />
80%<br />
70%<br />
60%<br />
50%<br />
40%<br />
30%<br />
20%<br />
10%<br />
0%<br />
Girls<br />
400-m MR 400-m FR 800-m FR Total<br />
Boys<br />
400-m MR 400-m FR 800-m FR Total<br />
14 yrs<br />
15 yrs<br />
16 yrs<br />
17 yrs<br />
15 yrs<br />
16 yrs<br />
17 yrs<br />
18 yrs<br />
Figure 2. The relative frequency distributions (%) of the top 8 relay<br />
members <strong>and</strong> the total f<strong>in</strong>alists of three relays (Total, N = 96) for the<br />
four age categories.<br />
MR, medley relay; FR, freestyle relay<br />
Table 1. Mean relative frequency distributions (%) of the top 8 swimmers<br />
<strong>and</strong> the top 8 relay members over all events for the four age categories.<br />
Girls Boys<br />
Age (yrs) Age (yrs)<br />
17 47.8 ± 14.2 ‡ 55.2 ± 6.5 ‡ 18 64.7 ± 8.9 ‡ 74.0 ± 7.9 ‡<br />
16 31.6 ± 10.9 ‡ 26.0 ± 9.0 ¶ 17 27.2 ± 6.2 ‡ 25.0 ± 8.3 ‡<br />
15 11.8 ± 7.0 † 13.5 ± 4.8 * 16 7.4 ± 8.8 † 0 ± 0 †<br />
14 8.8 ± 19.0 † 5.2 ± 6.5 † 15 0.7 ± 2.1 † 1.0 ± 1.8 †<br />
IE f<strong>in</strong>alists Relay members IE f<strong>in</strong>alists Relay members<br />
IE, <strong>in</strong>dividual event<br />
‡ Significantly different from all other age categories (p < 0.05).<br />
† Significantly different from two oldest age categories (p < 0.05).<br />
¶ Significantly different from the youngest <strong>and</strong> oldest age categories<br />
(p < 0.05).<br />
* Significantly different from the oldest age category (p < 0.05).<br />
To <strong>in</strong>vestigate the chance to advance to the f<strong>in</strong>als <strong>and</strong> therefore to score,<br />
i.e., chance of success, for swimmers <strong>in</strong> each CA category, the ratio of the<br />
number of top 8 swimmers to total competitors <strong>in</strong> each event was exam<strong>in</strong>ed<br />
(Table 2). No significant difference <strong>in</strong> the mean ratio for the 17 <strong>in</strong>dividual<br />
events among CAs was found <strong>in</strong> girls, while the mean ratio <strong>in</strong> boys<br />
was significantly different (p < 0.01) <strong>and</strong> related to age (r = 0.59, p < 0.01).<br />
Table 2. The mean ratio of the number of f<strong>in</strong>alists to the total competitors<br />
over 17 events by age category.<br />
Girls Boys<br />
Age (yrs) Mean ratio Age (yrs) Mean ratio<br />
17 0.21 ± 0.10 18 0.20 ± 0.06 ‡<br />
16 0.21 ± 0.14 17 0.16 ± 0.07 †<br />
15 0.11 ± 0.11 16 0.08 ± 0.11<br />
14 0.16 ± 0.18 15 0.03 ± 0.12<br />
‡ Significantly different from the two youngest age categories (p < 0.05)<br />
† Significantly different from the youngest age category (p < 0.05)<br />
dIscussIon<br />
The hypothesis that older swimmers with<strong>in</strong> the designated age-groups represent<br />
the majority of swims <strong>in</strong> the f<strong>in</strong>als <strong>and</strong> that of competition at large<br />
was supported by the analyses. There were a greater number of older participants<br />
<strong>and</strong> f<strong>in</strong>alists <strong>in</strong> both sexes. Furthermore, the odds of advanc<strong>in</strong>g to<br />
the f<strong>in</strong>als for boys were significantly greater for the oldest swimmers at the<br />
Championships. By comb<strong>in</strong><strong>in</strong>g four ages <strong>in</strong>to a s<strong>in</strong>gle competitive cohort,<br />
participation was <strong>in</strong>fluenced <strong>and</strong> thus performance outcomes at the FINA<br />
Youth Championships were nearly predeterm<strong>in</strong>ed. Although “fairness” was<br />
not a goal at this <strong>in</strong>ternational event, the age-group<strong>in</strong>g system employed did<br />
not provide the younger swimmers with<strong>in</strong> age-groups with an equal chance<br />
of experienc<strong>in</strong>g a higher level of competition or any competitive success.<br />
Age-related variations <strong>in</strong> physiological parameters related to sports<br />
performance dur<strong>in</strong>g adolescence are well documented (Mal<strong>in</strong>a et al.,<br />
2004). These variations are attributable ma<strong>in</strong>ly to maturity status <strong>and</strong><br />
size differences (e.g., limb length, height, <strong>and</strong> muscle mass) <strong>and</strong> become<br />
more apparent dur<strong>in</strong>g <strong>and</strong> after the growth spurt, especially <strong>in</strong> boys. One<br />
marker of maturation is the age at peak height velocity (PHV: on average,<br />
age 12 <strong>in</strong> girls <strong>and</strong> age 14 <strong>in</strong> boys). Regard<strong>in</strong>g swim performance data,<br />
Pelayo et al. (1997) reported age-related differences <strong>in</strong> the performance<br />
of non-skilled students aged 11 to 17 years. Also, Kojima et al. (2009)<br />
recently demonstrated age-related differences <strong>in</strong> the swim times of the top<br />
100 U.S. swimmers from age 5 to 20 years. Both studies found significant<br />
differences <strong>in</strong> swim performance between 14- <strong>and</strong> 17-year-old girls, while<br />
swim performance of boys <strong>in</strong> 15 to 17 year-old categories was significantly<br />
different from each other. In each case, younger swimmers were slower<br />
than older swimmers. Girls reach a po<strong>in</strong>t where age (<strong>and</strong> maturity) is less<br />
of an issue about two years earlier than boys.<br />
In the present study, younger swimmers typically placed lower than<br />
older swimmers (Figure 1). N<strong>in</strong>e 14 <strong>and</strong> 15 year-old girls (out of 51,


