

Biomechanics and Medicine in Swimming XI
Biomechanics and Medicine in Swimming XI
Biomechanics and Medicine in Swimming XI

Create successful ePaper yourself
Turn your PDF publications into a flip-book with our unique Google optimized e-Paper software.
V = the swimmer’s free swim maximum velocity <strong>and</strong><br />
1<br />
V = 5% greater<br />
2<br />
than the swimmer’s free swim maximum velocity (Kolmogorov & Duplishcheva,<br />
1992) (Note: equation was modified for assisted, rather than<br />
resisted). To identify the force distribution with<strong>in</strong> the stroke cycle, phases<br />
were considered as entry <strong>and</strong> catch, pull, push <strong>and</strong> recovery (Chollet<br />
et al, 2000).<br />
chaPter2.<strong>Biomechanics</strong><br />
± 7.2 N at 1.76 m·s-1 for female participants (Maglischo et al, 1988).<br />
Similarly, Kolmogorov & Duplishcheva (1992) observed male <strong>and</strong> female<br />
passive values rang<strong>in</strong>g from 69.7 – 103.0 N <strong>and</strong> 44.2 - 56.9 N, respectively<br />
at velocities 1.73 - 1.91 m·s-1<strong>and</strong> 1.52 - 1.67 m·s-1 , respectively.<br />
The active drag obta<strong>in</strong>ed <strong>in</strong> this study does not concur with the<br />
literature. Toussa<strong>in</strong>t et al. (2004) compared active drag values collected<br />
with both the MAD <strong>and</strong> VPM systems. Active drag measured at a velocity<br />
of 1.64 m·s -1 was 66.9 N (MAD) <strong>and</strong> 53.2 N (VPM). Similar<br />
f<strong>in</strong>d<strong>in</strong>gs were reported by Toussa<strong>in</strong>t et al. (1988) when compar<strong>in</strong>g active<br />
results<br />
The coefficient of variation between the tow<strong>in</strong>g device velocity <strong>and</strong> the<br />
side-on cameras was 0.6 % (90% Confidence Intervals (CI) 0.5 to 0.7).<br />
The Pearson product moment coefficient between the tow<strong>in</strong>g device<br />
pull<strong>in</strong>g velocity <strong>and</strong> the calculated side-on camera velocity was r =1.0.<br />
With<strong>in</strong> a test<strong>in</strong>g day the typical error of measurement from the force<br />
platform set up was 4.0 N (90% CI 3.4 to 4.8) or 5.2% (4.4 to 6.3) for<br />
passive drag; <strong>and</strong> 2.5 N (2.1 to 3.0) or 4.9% (4.1 to 5.9) for the active<br />
drag. Test<strong>in</strong>g sessions with<strong>in</strong> <strong>and</strong> between days of test<strong>in</strong>g, reported <strong>in</strong>traclass<br />
correlation coefficients (ICCs) of between 0.97 (0.93 to 0.99)<br />
<strong>and</strong> 0.99 (0.96 to 1.00) for passive <strong>and</strong> active drag respectively.<br />
The mean passive drag value for the male participants was 78.9 ±<br />
1.6 N at a mean velocity of 1.89 m·s<br />
83<br />
-1 , whilst the mean passive drag value<br />
for the female participants was 49.7 ± 1.8 N at a mean velocity of 1.72<br />
m·s-1 . The mean active drag value for the male participants was 228.4<br />
± 10.8 N at a maximum velocity of 1.89 m·s-1 , compared to the female<br />
mean value of 164.4 ± 11.7 N, at a maximum velocity of 1.72 m·s-1 104<br />
<strong>Biomechanics</strong> <strong>and</strong> <strong>Medic<strong>in</strong>e</strong> <strong>XI</strong> Chapter 2 <strong>Biomechanics</strong><br />
.<br />
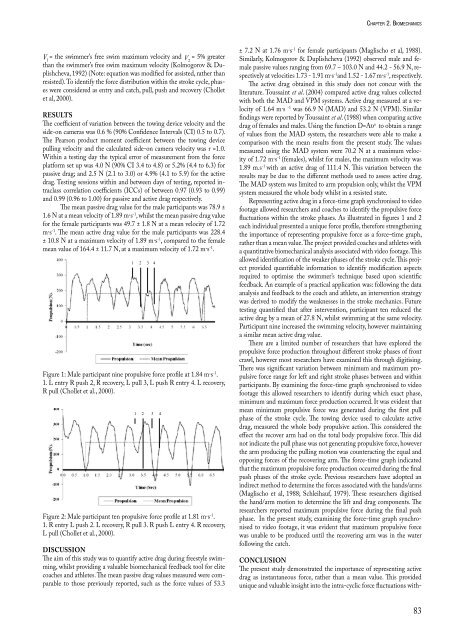
Figure 1: Male participant n<strong>in</strong>e propulsive force profile at 1.84 m·s -1 .<br />
1. L entry R push 2, R recovery, L pull 3, L push R entry 4. L recovery, R pull (Chollet<br />
et al., 2000).<br />
Figure 2: Male participant ten propulsive force profile at 1.81 m·s -1 .<br />
1. R entry L push 2. L recovery, R pull 3. R push L entry 4. R recovery, L pull (Chollet<br />
et al., 2000).<br />
DISCUSSION<br />
The aim of this study was to quantify active drag dur<strong>in</strong>g freestyle swimm<strong>in</strong>g, whilst<br />
provid<strong>in</strong>g a valuable biomechanical feedback tool for elite coaches <strong>and</strong> athletes. The<br />
mean passive drag values measured were comparable to those previously reported, such<br />
as the force values of 53.3 ± 7.2 N at 1.76 m·s -1 for female participants (Maglischo et al,<br />
1988). Similarly, Kolmogorov & Duplishcheva (1992) observed male <strong>and</strong> female<br />
passive values rang<strong>in</strong>g from 69.7 – 103.0 N <strong>and</strong> 44.2 - 56.9 N, respectively at velocities<br />
1.73 - 1.91 m·s -1 <strong>and</strong> 1.52 - 1.67 m·s -1 1 2 3 4<br />
Figure 1: Male participant n<strong>in</strong>e propulsive force profile at 1.84 m·s<br />
1 2 3 4<br />
, respectively.<br />
The active drag obta<strong>in</strong>ed <strong>in</strong> this study does not concur with the literature. Toussa<strong>in</strong>t<br />
et al. (2004) compared active drag values collected with both the MAD <strong>and</strong> VPM<br />
-1 104<br />
<strong>Biomechanics</strong> <strong>and</strong> <strong>Medic<strong>in</strong>e</strong> <strong>XI</strong> Chapter 2 <strong>Biomechanics</strong><br />
.<br />
1. Figure L entry 1: R Male push participant 2, R recovery, n<strong>in</strong>e L propulsive pull 3, L push force R profile entry 4. at L 1.84 recovery, m·s<br />
R pull (Chollet et al., 2000).<br />
-1 .<br />
1. L entry R push 2, R recovery, L pull 3, L push R entry 4. L recovery, R pull (Chollet<br />
et al., 2000).<br />
Figure 2: Male participant ten propulsive force profile at 1.81 m·s -1 .<br />
1. R entry L push 2. L recovery, R pull 3. R push L entry 4. R recovery, L pull (Chollet<br />
et al., 2000).<br />
DISCUSSION<br />
The aim of this study was to quantify active drag dur<strong>in</strong>g freestyle swimm<strong>in</strong>g, whilst<br />
provid<strong>in</strong>g a valuable biomechanical feedback tool for elite coaches <strong>and</strong> athletes. The<br />
mean passive drag values measured were comparable to those previously reported, such<br />
as the force values of 53.3 ± 7.2 N at 1.76 m·s -1 for female participants (Maglischo et al,<br />
1988). Similarly, Kolmogorov & Duplishcheva (1992) observed male <strong>and</strong> female<br />
passive values rang<strong>in</strong>g from 69.7 – 103.0 N <strong>and</strong> 44.2 - 56.9 N, respectively at velocities<br />
1.73 - 1.91 m·s -1 <strong>and</strong> 1.52 - 1.67 m·s -1 1 2 3 4<br />
1 2 3 4<br />
Figure 2: Male participant ten propulsive force profile at 1.81 m·s<br />
, respectively.<br />
The active drag obta<strong>in</strong>ed <strong>in</strong> this study does not concur with the literature. Toussa<strong>in</strong>t<br />
et al. (2004) compared active drag values collected with both the MAD <strong>and</strong> VPM<br />
-1 drag of females <strong>and</strong> males. Us<strong>in</strong>g the function D=Aυ<br />
.<br />
1. R entry L push 2. L recovery, R pull 3. R push L entry 4. R recovery,<br />
L pull (Chollet et al., 2000).<br />
dIscussIon<br />
The aim of this study was to quantify active drag dur<strong>in</strong>g freestyle swimm<strong>in</strong>g,<br />
whilst provid<strong>in</strong>g a valuable biomechanical feedback tool for elite<br />
coaches <strong>and</strong> athletes. The mean passive drag values measured were comparable<br />
to those previously reported, such as the force values of 53.3<br />
n to obta<strong>in</strong> a range<br />
of values from the MAD system, the researchers were able to make a<br />
comparison with the mean results from the present study. The values<br />
measured us<strong>in</strong>g the MAD system were 70.2 N at a maximum velocity<br />
of 1.72 m·s-1 (females), whilst for males, the maximum velocity was<br />
1.89 m.s-1 with an active drag of 111.4 N. This variation between the<br />
results may be due to the different methods used to assess active drag.<br />
The MAD system was limited to arm propulsion only, whilst the VPM<br />
system measured the whole body whilst <strong>in</strong> a resisted state.<br />
Represent<strong>in</strong>g active drag <strong>in</strong> a force-time graph synchronised to video<br />
footage allowed researchers <strong>and</strong> coaches to identify the propulsive force<br />
fluctuations with<strong>in</strong> the stroke phases. As illustrated <strong>in</strong> figures 1 <strong>and</strong> 2<br />
each <strong>in</strong>dividual presented a unique force profile, therefore strengthen<strong>in</strong>g<br />
the importance of represent<strong>in</strong>g propulsive force as a force–time graph,<br />
rather than a mean value. The project provided coaches <strong>and</strong> athletes with<br />
a quantitative biomechanical analysis associated with video footage. This<br />
allowed identification of the weaker phases of the stroke cycle. This project<br />
provided quantifiable <strong>in</strong>formation to identify modification aspects<br />
required to optimise the swimmer’s technique based upon scientific<br />
feedback. An example of a practical application was: follow<strong>in</strong>g the data<br />
analysis <strong>and</strong> feedback to the coach <strong>and</strong> athlete, an <strong>in</strong>tervention strategy<br />
was derived to modify the weaknesses <strong>in</strong> the stroke mechanics. Future<br />
test<strong>in</strong>g quantified that after <strong>in</strong>tervention, participant ten reduced the<br />
active drag by a mean of 27.8 N, whilst swimm<strong>in</strong>g at the same velocity.<br />
Participant n<strong>in</strong>e <strong>in</strong>creased the swimm<strong>in</strong>g velocity, however ma<strong>in</strong>ta<strong>in</strong><strong>in</strong>g<br />
a similar mean active drag value.<br />
There are a limited number of researchers that have explored the<br />
propulsive force production throughout different stroke phases of front<br />
crawl, however most researchers have exam<strong>in</strong>ed this through digitis<strong>in</strong>g.<br />
There was significant variation between m<strong>in</strong>imum <strong>and</strong> maximum propulsive<br />
force range for left <strong>and</strong> right stroke phases between <strong>and</strong> with<strong>in</strong><br />
participants. By exam<strong>in</strong><strong>in</strong>g the force-time graph synchronised to video<br />
footage this allowed researchers to identify dur<strong>in</strong>g which exact phase,<br />
m<strong>in</strong>imum <strong>and</strong> maximum force production occurred. It was evident that<br />
mean m<strong>in</strong>imum propulsive force was generated dur<strong>in</strong>g the first pull<br />
phase of the stroke cycle. The tow<strong>in</strong>g device used to calculate active<br />
drag, measured the whole body propulsive action. This considered the<br />
effect the recover arm had on the total body propulsive force. This did<br />
not <strong>in</strong>dicate the pull phase was not generat<strong>in</strong>g propulsive force, however<br />
the arm produc<strong>in</strong>g the pull<strong>in</strong>g motion was counteract<strong>in</strong>g the equal <strong>and</strong><br />
oppos<strong>in</strong>g forces of the recover<strong>in</strong>g arm. The force-time graph <strong>in</strong>dicated<br />
that the maximum propulsive force production occurred dur<strong>in</strong>g the f<strong>in</strong>al<br />
push phases of the stroke cycle. Previous researchers have adopted an<br />
<strong>in</strong>direct method to determ<strong>in</strong>e the forces associated with the h<strong>and</strong>s/arms<br />
(Maglischo et al, 1988; Schleihauf, 1979). These researchers digitised<br />
the h<strong>and</strong>/arm motion to determ<strong>in</strong>e the lift <strong>and</strong> drag components. The<br />
researchers reported maximum propulsive force dur<strong>in</strong>g the f<strong>in</strong>al push<br />
phase. In the present study, exam<strong>in</strong><strong>in</strong>g the force-time graph synchronised<br />
to video footage, it was evident that maximum propulsive force<br />
was unable to be produced until the recover<strong>in</strong>g arm was <strong>in</strong> the water<br />
follow<strong>in</strong>g the catch.<br />
conclusIon<br />
The present study demonstrated the importance of represent<strong>in</strong>g active<br />
drag as <strong>in</strong>stantaneous force, rather than a mean value. This provided<br />
unique <strong>and</strong> valuable <strong>in</strong>sight <strong>in</strong>to the <strong>in</strong>tra-cyclic force fluctuations with-


