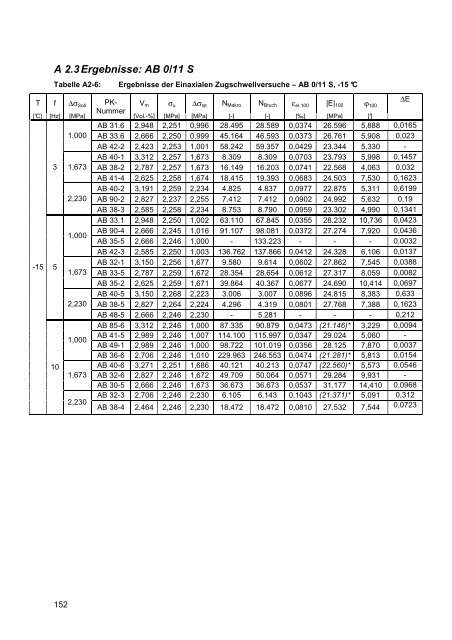
A 2.3 Ergebnisse: AB 0/11 S Tabelle A2-6: Ergebnisse der Einaxialen Zugschwellversuche – AB 0/11 S, -15 °C T f ∆σ Soll PK- V m σ u ∆σ Ist N Makro N Bruch ε el,100 |E| 100 ϕ 100 ∆E [°C] [Hz] [MPa] Nummer [Vol.-%] [MPa] [MPa] [-] [-] [‰] [MPa] [°] AB 31.6 2,948 2,251 0,996 28.495 28.589 0,0374 26.596 5,888 0,0165 1,000 AB 33.6 2,666 2,250 0,999 45.164 46.593 0,0373 26.761 5,908 0,023 AB 42-2 2,423 2,253 1,001 58.242 59.357 0,0429 23.344 5,330 - AB 40-1 3,312 2,257 1,673 8.309 8.309 0,0703 23.793 5,998 0,1457 3 1,673 AB 38-2 2,787 2,257 1,673 16.149 16.203 0,0741 22.568 4,063 0,032 AB 41-4 2,625 2,258 1,674 18.415 19.393 0,0683 24.503 7,530 0,1623 AB 40-2 3,191 2,259 2,234 4.825 4.837 0,0977 22.875 5,311 0,6199 2,230 AB 90-2 2,827 2,237 2,255 7.412 7.412 0,0902 24.992 5,632 0,19 AB 38-3 2,585 2,258 2,234 8.753 8.790 0,0959 23.302 4,990 0,1341 AB 33.1 2,948 2,250 1,002 63.110 67.845 0,0355 28.232 10,736 0,0423 1,000 AB 90-4 2,666 2,245 1,016 91.107 98.081 0,0372 27.274 7,920 0,0436 AB 35-5 2,666 2,246 1,000 - 133.223 - - - 0,0032 AB 42-3 2,585 2,250 1,003 136.762 137.866 0,0412 24.328 6,106 0,0137 -15 5 AB 32-1 3,150 2,256 1,677 9.580 9.614 0,0602 27.862 7,545 0,0388 1,673 AB 33-5 2,787 2,259 1,672 28.354 28.654 0,0612 27.317 8,059 0,0082 AB 35-2 2,625 2,259 1,671 39.864 40.367 0,0677 24.690 10,414 0,0697 AB 40-5 3,150 2,268 2,223 3.006 3.007 0,0896 24.815 8,383 0,633 2,230 AB 38-5 2,827 2,264 2,224 4.296 4.319 0,0801 27.768 7,388 0,1623 AB 48-5 2,666 2,246 2,230 - 5.281 - - - 0,212 AB 85-6 3,312 2,246 1,000 87.335 90.879 0,0473 (21.146)* 3,229 0,0094 1,000 AB 41-5 2,989 2,246 1,007 114.100 115.997 0,0347 29.024 5,060 - AB 49-1 2,989 2,246 1,000 98.722 101.019 0,0356 28.125 7,870 0,0037 AB 36-6 2,706 2,246 1,010 229.963 246.553 0,0474 (21.281)* 5,813 0,0154 10 AB 40-6 3,271 2,251 1,686 40.121 40.213 0,0747 (22.560)* 5,573 0,0546 1,673 AB 32-6 2,827 2,246 1,672 49.709 50.064 0,0571 29.284 9,931 - AB 30-5 2,666 2,246 1,673 36.673 36.673 0,0537 31.177 14,410 0,0968 2,230 AB 32-3 2,706 2,246 2,230 6.105 6.143 0,1043 (21.371)* 5,091 0,312 AB 38-4 2,464 2,246 2,230 18.472 18.472 0,0810 27.532 7,544 0,0723 152
Tabelle A2-7: Ergebnisse der Einaxialen Zugschwellversuche – AB 0/11 S, -10 °C T f ∆σ Soll PK- V m σ u ∆σ Ist N Makro N Bruch ε el,100 |E| 100 ϕ 100 ∆E [°C] [Hz] [MPa] Nummer [Vol.-%] [MPa] [MPa] [-] [-] [‰] [MPa] [°] -10 3 5 10 AB 101-6 3,150 1,181 0,997 209.602 217.748 0,0429 23.222 8,180 0,0192 1,000 AB 138-2 2,827 1,177 0,995 126.241 133.400 0,0417 23.831 10,156 0,0223 AB 138-3 2,706 1,179 0,998 79.749 83.325 0,0450 22.193 6,396 0,0159 AB 137-5 2,504 1,174 0,997 167.741 180.057 - - - - 1,518 AB 136-3 2,827 1,180 1,517 43.821 44.676 0,0675 22.474 5,604 0,0663 AB 101-1 3,433 1,182 1,688 49.468 49.468 - - - - AB 137-1 2,666 1,183 1,693 24.536 25.785 0,0741 22.829 5,993 0,0873 1,696 AB 101-5 3,029 1,171 1,696 30.793 32.125 0,0736 23.031 6,034 - AB 31-5 2,827 1,181 1,689 28.542 29.883 - - - - AB 138-6 2,625 1,180 1,690 31.143 32.644 - - - - AB99-3b 3,069 1,190 1,694 34.068 35.247 0,0788 21.491 5,512 0,0353 AB 102-2 2,989 1,197 2,251 20.374 20.618 0,0875 25.722 7,880 0,9046 2,261 AB 139-2 2,787 1,193 2,252 10.489 10.622 - - - - AB 136-2 2,504 1,188 2,251 11.150 11.497 0,1008 22.335 - - AB 101-2 3,110 1,171 1,000 302.208 321.183 0,0431 23.194 - - 1,000 AB 136-6 2,787 1,175 1,000 196.780 208.260 0,0416 24.055 6,193 0,0195 AB 137-3 2,423 1,177 0,998 293.003 348.866 0,0363 (27.516)* 9,495 - AB 99-6 3,191 1,183 1,695 53.850 54.763 0,0830 20.416 4,127 0,0079 1,696 AB 136-1 2,504 1,179 1,695 51.143 55.312 0,0672 25.213 5,926 0,0488 AB 137-4 2,827 1,181 1,694 68.344 70.357 0,0686 24.708 5,655 0,0388 2,261 AB 102-6 3,069 1,184 2,262 21.651 21.912 0,0980 23.078 5,302 0,1212 AB 139-5 2,787 1,186 2,264 17.441 17.985 0,1251 (18.096)* 6,078 0,105 AB 99-3 3,069 1,172 1,004 555.980 579.910 0,0395 25.438 4,925 0,0055 1,000 AB 35-4 2,787 1,173 1,006 617.005 703.505 0,0403 24.947 5,222 0,00515 AB 138-4 2,666 1,179 0,998 591.522 636.541 0,0490 (20.367)* 5,877 0,0025 AB 99-1 3,150 1,179 1,708 95.651 100.068 0,0728 23.450 6,447 - 1,696 AB 139-6 2,787 1,183 1,696 - 148.999 - - - - AB 139-4 2,948 1,171 1,696 75.783 78.187 0,0655 25.895 6,506 0,016 AB 139-3 2,666 1,185 1,698 - 116.532 - - - - AB 139-1 3,029 1,185 2,267 42.832 44.574 0,1043 (21.732)* 5,335 0,0573 AB 138-5 2,827 1,186 2,267 33.152 35.549 0,0877 25.854 5,803 0,07985 2,261 AB 137-2 2,423 1,182 2,269 38.300 44.025 - - - - AB 137-6 2,787 1,171 2,261 28.346 30.523 0,0866 26.118 6,679 0,0833 AB 136-4 2,706 1,171 2,261 30.124 31.181 0,0954 23.690 6,043 0,0527 153
- Seite 1:
Dimensionierungsrelevante Prognose
- Seite 4 und 5:
Abstract The resistance against fat
- Seite 6 und 7:
und Herrn Dr.-Ing. Markus Oeser mö
- Seite 8 und 9:
3.4.3 Versuchsergebnisse...........
- Seite 10 und 11:
werden konnten, im Vorfeld der Baum
- Seite 12 und 13:
Zunächst wird in Kapitel 4 der Ein
- Seite 14 und 15:
Als Bindemittel kommt Bitumen zum E
- Seite 16 und 17:
Wegmesseinrichtungen gemessen werde
- Seite 18 und 19:
2.4 Rheologie von Asphalt 2.4.1 Rhe
- Seite 20 und 21:
2.4.1.5 Voigt-Kelvin-Modell Das Voi
- Seite 22 und 23:
2.4.3 Reaktion rheologischer Modell
- Seite 24 und 25:
E Dämpfer σa σa = = ε σ a a =
- Seite 26 und 27:
2.4.3.5 Dehnungsfunktion des Voigt-
- Seite 28 und 29:
0,0040 0,0035 Dehnung ε [-] 0,0030
- Seite 30 und 31:
eignet sich für die Ermittlung des
- Seite 32 und 33:
Energie dissipiert als zu Beginn de
- Seite 34 und 35:
Phase I Phase II Phase III Dreiphas
- Seite 36 und 37:
der Dehnungsreaktion des Asphaltes,
- Seite 38 und 39:
Bodin [9] wählt zur Berechnung der
- Seite 40 und 41:
Tabelle 3.1: Zusammensetzung der un
- Seite 42 und 43:
Abbildung 3-2 Tabelle 3.2: Asphalta
- Seite 44 und 45:
Die Differenz aus der Zugfestigkeit
- Seite 46 und 47:
weisen die Probekörper aus ABi 0/1
- Seite 48 und 49:
Die während der Belastung gemessen
- Seite 50 und 51:
such bei der Prüftemperatur des Zu
- Seite 52 und 53:
mungen des Probekörpers zu ermitte
- Seite 54 und 55:
absoluten E-Modul beobachtet werden
- Seite 56 und 57:
Energy Ratio ER 25.000 Energy Ratio
- Seite 58 und 59:
N Makro C 1 C 2 el,100 = ⋅ ε Gle
- Seite 60 und 61:
4 Auswirkungen der Materialermüdun
- Seite 62 und 63:
Tabelle 4.1: Parameter K 1 , K 2 ,
- Seite 64 und 65:
100.000 100.000 Versuchsdauer bis M
- Seite 66 und 67:
-10 Exponent K 2 -9 -8 -7 -6 -5 -4
- Seite 68 und 69:
Die in Abbildung 4-6 dargestellten
- Seite 70 und 71:
Den Einfluss der Bindemittelviskosi
- Seite 72 und 73:
Bei einer Belastungsfrequenz von f
- Seite 74 und 75:
Abbildung 4-11: Vergleich der mitte
- Seite 76 und 77:
10.000.000 y = 1,4876x 0,9602 R 2 =
- Seite 78 und 79:
Mit Dehnungsabhängigen Ermüdungsk
- Seite 80 und 81:
Bei den in [24] untersuchten Asphal
- Seite 82 und 83:
1. Ermittlung der ertragbaren Lastw
- Seite 84 und 85:
Tabelle 5.1: SMA 0/11 S (I) SMA 0/1
- Seite 86 und 87:
5.2 Temperatur-Frequenz-Äquivalenz
- Seite 88 und 89:
deutlichen Unterschiede des absolut
- Seite 90 und 91:
0,50 0,45 0,40 0,35 SMA 0/11 S (I)
- Seite 92 und 93:
Tabelle 5.3: Temperatur T [°C] SMA
- Seite 94 und 95:
ähnliche Verläufe, wie der rechte
- Seite 96 und 97:
denen Frequenzen offensichtlich all
- Seite 98 und 99:
Abbildung 6-4 zeigt die Mittelwerte
- Seite 100 und 101:
Durch Fehlerquadratminimierung kön
- Seite 102 und 103: Dieser Zusammenhang kann auch für
- Seite 104 und 105: Auch die Faktoren b i , die die Abh
- Seite 106 und 107: der Spannung, zu einer Zunahme der
- Seite 108 und 109: erfolgen. Für Temperaturen, bei de
- Seite 110 und 111: ε Burgers E ⎛ 2 ( σm ) − ⋅t
- Seite 112 und 113: ε i = ε E ,i 1 σ = E i 1,i + ε
- Seite 114 und 115: akkumulierte bleibende Dehnung εak
- Seite 116 und 117: 0,02 Dehnung ε [-] 0,018 0,016 0,0
- Seite 118 und 119: 6.5 Schlussfolgerung Mit Hilfe des
- Seite 120 und 121: Bei einer Belastungsfrequenz von f
- Seite 122 und 123: die Ermittlung der vier benötigten
- Seite 124 und 125: Literatur [1] Arand, W.; Rubach, C.
- Seite 126 und 127: [19] Hopman, P.; Kunst, P.; Pronk,
- Seite 128 und 129: [38] Wistuba, M.; Lackner, R.; Blab
- Seite 130 und 131: S 1 Koeffizient der Funktion zur Be
- Seite 132 und 133: Abbildung 3.5: Prozentualer Anteil
- Seite 134 und 135: Abbildung 5.4 Ermittlung der Steigu
- Seite 136 und 137: Abbildung 6.17 Abbildung 7.1: Abbil
- Seite 138 und 139: 138
- Seite 140 und 141: 140
- Seite 142 und 143: Tabelle A1-2: Ergebnisse der Zug- u
- Seite 144 und 145: Tabelle A1-4: Ergebnisse der Zug- u
- Seite 146 und 147: Tabelle A1-6: Ergebnisse der Zug- u
- Seite 148 und 149: Tabelle A2-2: Ergebnisse der Einaxi
- Seite 150 und 151: Tabelle A2-4: Ergebnisse der Einaxi
- Seite 154 und 155: Tabelle A2-8: Ergebnisse der Einaxi
- Seite 156 und 157: A 2.4 Ergebnisse: OPA 0/8 Tabelle A
- Seite 158 und 159: Tabelle A2-12: Ergebnisse der Einax
- Seite 160 und 161: A 3 Ermüdungsfunktionen A 3.1 Erm
- Seite 162 und 163: Bis zum Makroriss ertragene Lastwec
- Seite 164 und 165: A 3.2 Ermüdungsfunktionen: SMA 0/1
- Seite 166 und 167: Bis zum Makroriss ertragene Lastwec
- Seite 168 und 169: A 3.4 Ermüdungsfunktionen: OPA 0/8
- Seite 170 und 171: Bis zum Makroriss ertragene Lastwec
- Seite 172 und 173: Bis zum Makroriss ertragene Lastwec
- Seite 174 und 175: A 3.6 Ermüdungsfunktionen: ATS 0/3
- Seite 176 und 177: 10.000.000 Bei einer Belastungsfreq
- Seite 178 und 179: 1.000.000 Prognostizierte Lastwechs
- Seite 180 und 181: 1.000.000 Prognostizierte Lastwechs
- Seite 182 und 183: Abbildung A6-3: Abhängigkeit der A
- Seite 184 und 185: A 6.2 Zeitliche Verläufe der relat
- Seite 186 und 187: Abbildung A6-11: Zeitliche Entwickl
- Seite 188 und 189: Abbildung A6-15: Zeitliche Entwickl
- Seite 190 und 191: Absoluter E-Modul |E| [MPa] 18000 1
- Seite 192 und 193: 6 SMA 0/11 S (I) 0°C 10 Hz; 1,0 MP
- Seite 194 und 195: A 7.3 Akkumulierte bleibende Dehnun
- Seite 196 und 197: A 7.4 Akkumulierte bleibende Dehnun
- Seite 198 und 199: 5 AB 0/16 S (I) -5°C 10 Hz; 1,0 MP
- Seite 200 und 201: A 7.6 Akkumulierte bleibende Dehnun
- Seite 202 und 203:
Tabelle A8-1: Ergebnisse der Retard
- Seite 204 und 205:
10.000 9.000 SMA 0/11 S (II) +20°C
- Seite 206 und 207:
Tabelle A8-7: Ergebnisse der Retard
- Seite 208 und 209:
18.000 16.000 AB 0/11 S +20°C 0,09
- Seite 210 und 211:
Tabelle A8-12: Ergebnisse der Retar
- Seite 212 und 213:
Tabelle A8-14: Ergebnisse der Retar
- Seite 214 und 215:
16.000 14.000 ABi 0/16 S (I) +20°C
- Seite 216 und 217:
Tabelle A8-20: Ergebnisse der Retar
- Seite 218 und 219:
Tabelle A8-22: Ergebnisse der Retar
- Seite 220 und 221:
A 8.2 Temperaturabhängigkeit der R
- Seite 222 und 223:
Konstante a λ2 10 9 8 7 6 5 4 3 2
- Seite 224:
Dehnung ε [-] 0,01 0,009 0,008 0,0