Tabelle A2-8: Ergebnisse der Einaxialen Zugschwellversuche – AB 0/11 S, -5 °C T f ∆σ Soll PK- V m σ u ∆σ Ist N Makro N Bruch ε el,100 |E| 100 ϕ 100 ∆E [°C] [Hz] [MPa] Nummer [Vol.-%] [MPa] [MPa] [-] [-] [‰] [MPa] [°] -5 3 5 10 1,000 1,550 2,067 1,000 1,550 2,067 1,000 1,550 2,067 AB 35-1 3,150 0,515 1,000 137.360 146.088 0,0438 22.833 12,899 0,0292 AB 33-2 2,868 0,515 1,000 197.779 211.373 0,0521 19.179 11,255 0,026 AB 49-2 2,423 0,515 1,000 96.366 112.297 0,0522 19.151 8,901 0,0198 AB 48-1 3,029 0,515 1,550 13.838 14.750 0,0837 18.519 10,786 0,2324 AB 85-5 2,868 0,515 1,550 22.966 23.750 0,0816 18.990 10,886 0,1092 AB 31-3 2,423 0,515 1,550 43.316 50.484 0,0706 21.943 9,766 - AB 40-4 2,948 0,507 2,112 7.310 8.139 0,1233 17.131 7,842 0,47 AB 36-4 2,868 0,506 2,115 7.762 8.286 0,1185 17.848 7,904 0,3419 AB 32-5 2,504 0,517 2,098 8.177 8.203 0,1068 19.642 7,442 - AB 50-6 3,029 0,515 1,000 229.772 225.316 0,0416 24.062 13,427 - AB 85-4 2,868 0,511 1,020 164.823 183.971 0,0566 18.014 8,329 0,0102 AB 41-2 2,423 0,511 1,022 226.862 251.646 0,0505 20.243 15,568 0,0113 AB 50-3 2,908 0,509 1,579 72.098 71.463 0,0830 19.023 7,768 - AB 136-5 2,868 0,515 1,550 90.746 99.242 0,0699 22.186 8,230 0,0383 AB 85-2 2,827 0,514 1,577 41.567 46.613 0,0893 17.647 7,161 - AB 35-6 2,585 0,514 1,577 49.625 50.017 - - - - AB 85-3 2,908 0,512 2,100 9.846 12.640 0,1067 19.684 8,983 0,4423 AB 27-4 2,625 0,512 2,101 15.817 15.817 0,1144 18.367 8,004 - AB 49-4 2,423 0,514 2,101 14.533 16.865 0,1126 18.661 8,763 - AB 41-3 3,029 0,506 1,028 471.446 481.026 0,0478 21.487 8,199 0,0154 AB 31-4 2,746 0,531 1,035 478.164 535.661 0,0461 22.481 10,850 - AB 36-2 2,544 0,507 1,030 438.697 488.839 0,0534 19.270 6,679 0,0045 AB 36-1 2,908 0,498 1,594 72.789 78.658 0,0883 18.052 7,139 - AB 49-3 2,827 0,503 1,591 - 146.469 0,0753 21.127 8,891 - AB 48-3 2,625 0,501 1,592 105.867 114.025 0,0758 20.998 8,620 0,011 AB 50-1 2,908 0,497 2,120 34.208 36.499 0,0984 21.552 8,512 0,1363 AB 32-2 2,746 0,502 2,111 25.745 28.225 0,0942 22.416 9,985 0,1471 AB 48-2 2,585 0,502 2,115 29.348 31.604 0,1110 19.054 7,135 0,0269 154
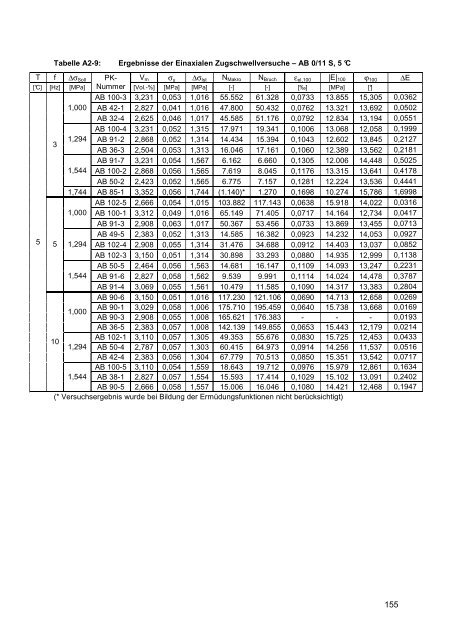
Tabelle A2-9: Ergebnisse der Einaxialen Zugschwellversuche – AB 0/11 S, 5 °C T f ∆σ Soll PK- V m σ u ∆σ Ist N Makro N Bruch ε el,100 |E| 100 ϕ 100 ∆E [°C] [Hz] [MPa] Nummer [Vol.-%] [MPa] [MPa] [-] [-] [‰] [MPa] [°] AB 100-3 3,231 0,053 1,016 55.552 61.328 0,0733 13.855 15,305 0,0362 1,000 AB 42-1 2,827 0,041 1,016 47.800 50.432 0,0762 13.321 13,692 0,0502 AB 32-4 2,625 0,046 1,017 45.585 51.176 0,0792 12.834 13,194 0,0551 AB 100-4 3,231 0,052 1,315 17.971 19.341 0,1006 13.068 12,058 0,1999 3 1,294 AB 91-2 2,868 0,052 1,314 14.434 15.394 0,1043 12.602 13,845 0,2127 AB 36-3 2,504 0,053 1,313 16.046 17.161 0,1060 12.389 13,562 0,2181 AB 91-7 3,231 0,054 1,567 6.162 6.660 0,1305 12.006 14,448 0,5025 1,544 AB 100-2 2,868 0,056 1,565 7.619 8.045 0,1176 13.315 13,641 0,4178 AB 50-2 2,423 0,052 1,565 6.775 7.157 0,1281 12.224 13,536 0,4441 1,744 AB 85-1 3,352 0,056 1,744 (1.140)* 1.270 0,1698 10.274 15,786 1,6998 AB 102-5 2,666 0,054 1,015 103.882 117.143 0,0638 15.918 14,022 0,0316 1,000 AB 100-1 3,312 0,049 1,016 65.149 71.405 0,0717 14.164 12,734 0,0417 AB 91-3 2,908 0,063 1,017 50.367 53.456 0,0733 13.869 13,455 0,0713 AB 49-5 2,383 0,052 1,313 14.585 16.382 0,0923 14.232 14,053 0,0927 5 5 1,294 AB 102-4 2,908 0,055 1,314 31.476 34.688 0,0912 14.403 13,037 0,0852 AB 102-3 3,150 0,051 1,314 30.898 33.293 0,0880 14.935 12,999 0,1138 AB 50-5 2,464 0,056 1,563 14.681 16.147 0,1109 14.093 13,247 0,2231 1,544 AB 91-6 2,827 0,058 1,562 9.539 9.991 0,1114 14.024 14,478 0,3787 AB 91-4 3,069 0,055 1,561 10.479 11.585 0,1090 14.317 13,383 0,2804 AB 90-6 3,150 0,051 1,016 117.230 121.106 0,0690 14.713 12,658 0,0269 1,000 AB 90-1 3,029 0,058 1,006 175.710 195.459 0,0640 15.738 13,668 0,0169 AB 90-3 2,908 0,055 1,008 165.621 176.383 - - - 0,0193 AB 36-5 2,383 0,057 1,008 142.139 149.855 0,0653 15.443 12,179 0,0214 10 AB 102-1 3,110 0,057 1,305 49.353 55.676 0,0830 15.725 12,453 0,0433 1,294 AB 50-4 2,787 0,057 1,303 60.415 64.973 0,0914 14.256 11,537 0,0516 AB 42-4 2,383 0,056 1,304 67.779 70.513 0,0850 15.351 13,542 0,0717 AB 100-5 3,110 0,054 1,559 18.643 19.712 0,0976 15.979 12,861 0,1634 1,544 AB 38-1 2,827 0,057 1,554 15.593 17.414 0,1029 15.102 13,091 0,2402 AB 90-5 2,666 0,058 1,557 15.006 16.046 0,1080 14.421 12,468 0,1947 (* Versuchsergebnis wurde bei Bildung der Ermüdungsfunktionen nicht berücksichtigt) 155
- Seite 1:
Dimensionierungsrelevante Prognose
- Seite 4 und 5:
Abstract The resistance against fat
- Seite 6 und 7:
und Herrn Dr.-Ing. Markus Oeser mö
- Seite 8 und 9:
3.4.3 Versuchsergebnisse...........
- Seite 10 und 11:
werden konnten, im Vorfeld der Baum
- Seite 12 und 13:
Zunächst wird in Kapitel 4 der Ein
- Seite 14 und 15:
Als Bindemittel kommt Bitumen zum E
- Seite 16 und 17:
Wegmesseinrichtungen gemessen werde
- Seite 18 und 19:
2.4 Rheologie von Asphalt 2.4.1 Rhe
- Seite 20 und 21:
2.4.1.5 Voigt-Kelvin-Modell Das Voi
- Seite 22 und 23:
2.4.3 Reaktion rheologischer Modell
- Seite 24 und 25:
E Dämpfer σa σa = = ε σ a a =
- Seite 26 und 27:
2.4.3.5 Dehnungsfunktion des Voigt-
- Seite 28 und 29:
0,0040 0,0035 Dehnung ε [-] 0,0030
- Seite 30 und 31:
eignet sich für die Ermittlung des
- Seite 32 und 33:
Energie dissipiert als zu Beginn de
- Seite 34 und 35:
Phase I Phase II Phase III Dreiphas
- Seite 36 und 37:
der Dehnungsreaktion des Asphaltes,
- Seite 38 und 39:
Bodin [9] wählt zur Berechnung der
- Seite 40 und 41:
Tabelle 3.1: Zusammensetzung der un
- Seite 42 und 43:
Abbildung 3-2 Tabelle 3.2: Asphalta
- Seite 44 und 45:
Die Differenz aus der Zugfestigkeit
- Seite 46 und 47:
weisen die Probekörper aus ABi 0/1
- Seite 48 und 49:
Die während der Belastung gemessen
- Seite 50 und 51:
such bei der Prüftemperatur des Zu
- Seite 52 und 53:
mungen des Probekörpers zu ermitte
- Seite 54 und 55:
absoluten E-Modul beobachtet werden
- Seite 56 und 57:
Energy Ratio ER 25.000 Energy Ratio
- Seite 58 und 59:
N Makro C 1 C 2 el,100 = ⋅ ε Gle
- Seite 60 und 61:
4 Auswirkungen der Materialermüdun
- Seite 62 und 63:
Tabelle 4.1: Parameter K 1 , K 2 ,
- Seite 64 und 65:
100.000 100.000 Versuchsdauer bis M
- Seite 66 und 67:
-10 Exponent K 2 -9 -8 -7 -6 -5 -4
- Seite 68 und 69:
Die in Abbildung 4-6 dargestellten
- Seite 70 und 71:
Den Einfluss der Bindemittelviskosi
- Seite 72 und 73:
Bei einer Belastungsfrequenz von f
- Seite 74 und 75:
Abbildung 4-11: Vergleich der mitte
- Seite 76 und 77:
10.000.000 y = 1,4876x 0,9602 R 2 =
- Seite 78 und 79:
Mit Dehnungsabhängigen Ermüdungsk
- Seite 80 und 81:
Bei den in [24] untersuchten Asphal
- Seite 82 und 83:
1. Ermittlung der ertragbaren Lastw
- Seite 84 und 85:
Tabelle 5.1: SMA 0/11 S (I) SMA 0/1
- Seite 86 und 87:
5.2 Temperatur-Frequenz-Äquivalenz
- Seite 88 und 89:
deutlichen Unterschiede des absolut
- Seite 90 und 91:
0,50 0,45 0,40 0,35 SMA 0/11 S (I)
- Seite 92 und 93:
Tabelle 5.3: Temperatur T [°C] SMA
- Seite 94 und 95:
ähnliche Verläufe, wie der rechte
- Seite 96 und 97:
denen Frequenzen offensichtlich all
- Seite 98 und 99:
Abbildung 6-4 zeigt die Mittelwerte
- Seite 100 und 101:
Durch Fehlerquadratminimierung kön
- Seite 102 und 103:
Dieser Zusammenhang kann auch für
- Seite 104 und 105: Auch die Faktoren b i , die die Abh
- Seite 106 und 107: der Spannung, zu einer Zunahme der
- Seite 108 und 109: erfolgen. Für Temperaturen, bei de
- Seite 110 und 111: ε Burgers E ⎛ 2 ( σm ) − ⋅t
- Seite 112 und 113: ε i = ε E ,i 1 σ = E i 1,i + ε
- Seite 114 und 115: akkumulierte bleibende Dehnung εak
- Seite 116 und 117: 0,02 Dehnung ε [-] 0,018 0,016 0,0
- Seite 118 und 119: 6.5 Schlussfolgerung Mit Hilfe des
- Seite 120 und 121: Bei einer Belastungsfrequenz von f
- Seite 122 und 123: die Ermittlung der vier benötigten
- Seite 124 und 125: Literatur [1] Arand, W.; Rubach, C.
- Seite 126 und 127: [19] Hopman, P.; Kunst, P.; Pronk,
- Seite 128 und 129: [38] Wistuba, M.; Lackner, R.; Blab
- Seite 130 und 131: S 1 Koeffizient der Funktion zur Be
- Seite 132 und 133: Abbildung 3.5: Prozentualer Anteil
- Seite 134 und 135: Abbildung 5.4 Ermittlung der Steigu
- Seite 136 und 137: Abbildung 6.17 Abbildung 7.1: Abbil
- Seite 138 und 139: 138
- Seite 140 und 141: 140
- Seite 142 und 143: Tabelle A1-2: Ergebnisse der Zug- u
- Seite 144 und 145: Tabelle A1-4: Ergebnisse der Zug- u
- Seite 146 und 147: Tabelle A1-6: Ergebnisse der Zug- u
- Seite 148 und 149: Tabelle A2-2: Ergebnisse der Einaxi
- Seite 150 und 151: Tabelle A2-4: Ergebnisse der Einaxi
- Seite 152 und 153: A 2.3 Ergebnisse: AB 0/11 S Tabelle
- Seite 156 und 157: A 2.4 Ergebnisse: OPA 0/8 Tabelle A
- Seite 158 und 159: Tabelle A2-12: Ergebnisse der Einax
- Seite 160 und 161: A 3 Ermüdungsfunktionen A 3.1 Erm
- Seite 162 und 163: Bis zum Makroriss ertragene Lastwec
- Seite 164 und 165: A 3.2 Ermüdungsfunktionen: SMA 0/1
- Seite 166 und 167: Bis zum Makroriss ertragene Lastwec
- Seite 168 und 169: A 3.4 Ermüdungsfunktionen: OPA 0/8
- Seite 170 und 171: Bis zum Makroriss ertragene Lastwec
- Seite 172 und 173: Bis zum Makroriss ertragene Lastwec
- Seite 174 und 175: A 3.6 Ermüdungsfunktionen: ATS 0/3
- Seite 176 und 177: 10.000.000 Bei einer Belastungsfreq
- Seite 178 und 179: 1.000.000 Prognostizierte Lastwechs
- Seite 180 und 181: 1.000.000 Prognostizierte Lastwechs
- Seite 182 und 183: Abbildung A6-3: Abhängigkeit der A
- Seite 184 und 185: A 6.2 Zeitliche Verläufe der relat
- Seite 186 und 187: Abbildung A6-11: Zeitliche Entwickl
- Seite 188 und 189: Abbildung A6-15: Zeitliche Entwickl
- Seite 190 und 191: Absoluter E-Modul |E| [MPa] 18000 1
- Seite 192 und 193: 6 SMA 0/11 S (I) 0°C 10 Hz; 1,0 MP
- Seite 194 und 195: A 7.3 Akkumulierte bleibende Dehnun
- Seite 196 und 197: A 7.4 Akkumulierte bleibende Dehnun
- Seite 198 und 199: 5 AB 0/16 S (I) -5°C 10 Hz; 1,0 MP
- Seite 200 und 201: A 7.6 Akkumulierte bleibende Dehnun
- Seite 202 und 203: Tabelle A8-1: Ergebnisse der Retard
- Seite 204 und 205:
10.000 9.000 SMA 0/11 S (II) +20°C
- Seite 206 und 207:
Tabelle A8-7: Ergebnisse der Retard
- Seite 208 und 209:
18.000 16.000 AB 0/11 S +20°C 0,09
- Seite 210 und 211:
Tabelle A8-12: Ergebnisse der Retar
- Seite 212 und 213:
Tabelle A8-14: Ergebnisse der Retar
- Seite 214 und 215:
16.000 14.000 ABi 0/16 S (I) +20°C
- Seite 216 und 217:
Tabelle A8-20: Ergebnisse der Retar
- Seite 218 und 219:
Tabelle A8-22: Ergebnisse der Retar
- Seite 220 und 221:
A 8.2 Temperaturabhängigkeit der R
- Seite 222 und 223:
Konstante a λ2 10 9 8 7 6 5 4 3 2
- Seite 224:
Dehnung ε [-] 0,01 0,009 0,008 0,0