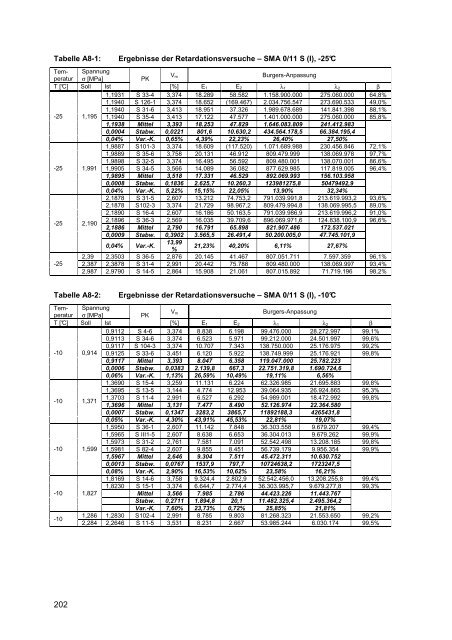
Tabelle A8-1: Ergebnisse der Retardationsversuche – SMA 0/11 S (I), -25°C Tabelle A8-2: Ergebnisse der Retardationsversuche – SMA 0/11 S (I), -10°C Temperatur σ [MPa] PK Spannung V m Burgers-Anpassung T [°C] Soll Ist [%] E 1 E 2 λ 1 λ 2 β 1,1931 S 33-4 3,374 18.289 58.582 1.158.900.000 275.060.000 64,8% 1,1940 S 126-1 3,374 18.652 (169.467) 2.034.756.547 273.690.533 49,0% 1,1940 S 31-6 3,413 18.951 37.326 1.989.678.689 141.841.398 88,1% -25 1,195 1,1940 S 35-4 3,413 17.122 47.577 1.401.000.000 275.060.000 85,8% 1,1938 Mittel 3,393 18.253 47.829 1.646.083.809 241.412.983 0,0004 Stabw. 0,0221 801,6 10.630,2 434.564.178,5 66.384.195,4 0,04% Var.-K. 0,65% 4,39% 22,23% 26,40% 27,50% 1,9887 S101-3 3,374 18.609 (117.520) 1.071.689.988 230.456.846 72,1% 1,9889 S 35-6 3,758 20.131 46.912 809.479.999 138.069.978 97,7% 1,9898 S 32-5 3,374 16.495 56.592 809.480.001 138.070.001 86,6% -25 1,991 1,9905 S 34-5 3,566 14.089 36.082 877.629.985 117.819.005 96,4% 1,9895 Mittel 3,518 17.331 46.529 892.069.993 156.103.958 0,0008 Stabw. 0,1836 2.625,7 10.260,3 123981275,8 50479492,9 0,04% Var.-K. 5,22% 15,15% 22,05% 13,90% 32,34% 2,1878 S 31-5 2,607 13.212 74.753,2 791.039.991,8 213.619.993,2 93,6% 2,1878 S102-3 3,374 21.729 98.967,2 809.479.994,8 138.069.995,5 89,0% 2,1890 S 16-4 2,607 16.186 50.163,5 791.039.986,9 213.619.996,2 91,0% -25 2,190 2,1896 S 36-3 2,569 16.035 39.709,6 896.069.971,6 124.838.100,9 96,6% 2,1886 Mittel 2,790 16.791 65.898 821.907.486 172.537.021 0,0009 Stabw. 0,3902 3.565,5 26.491,4 50.200.005,0 47.745.101,9 0,04% Var.-K. 13,99 % 21,23% 40,20% 6,11% 27,67% 2,39 2,3503 S 36-5 2,876 20.145 41.467 807.051.711 7.597.359 96,1% -25 2,387 2,3878 S 31-4 2,991 20.442 75.788 809.480.000 138.069.997 93,4% 2,987 2,9790 S 14-5 2,864 15.908 21.061 807.015.892 71.719.196 98,2% Temperatur σ [MPa] PK Spannung V m Burgers-Anpassung T [°C] Soll Ist [%] E 1 E 2 λ 1 λ 2 β 0,9112 S 4-6 3,374 8.838 6.198 99.476.000 28.272.997 99,1% 0,9113 S 34-6 3,374 6.523 5.971 99.212.000 24.501.997 99,6% 0,9117 S 104-3 3,374 10.707 7.343 138.750.000 25.176.975 99,2% -10 0,914 0,9125 S 33-6 3,451 6.120 5.922 138.749.999 25.176.921 99,8% 0,9117 Mittel 3,393 8.047 6.358 119.047.000 25.782.223 0,0006 Stabw. 0,0383 2.139,8 667,3 22.751.319,8 1.690.724,6 0,06% Var.-K. 1,13% 26,59% 10,49% 19,11% 6,56% 1,3690 S 15-4 3,259 11.131 6.224 62.326.985 21.695.883 99,8% 1,3695 S 13-5 3,144 4.774 12.953 39.064.935 26.924.865 95,3% -10 1,371 1,3703 S 11-4 2,991 6.527 6.292 54.989.001 18.472.992 99,8% 1,3696 Mittel 3,131 7.477 8.490 52.126.974 22.364.580 0,0007 Stabw. 0,1347 3283,2 3865,7 11892188,3 4265431,8 0,05% Var.-K. 4,30% 43,91% 45,53% 22,81% 19,07% 1,5950 S 36-1 2,607 11.142 7.848 36.303.558 9.679.207 99,4% 1,5965 S III1-5 2,607 8.638 6.653 36.304.013 9.679.262 99,9% 1,5973 S 31-2 2,761 7.581 7.091 52.542.498 13.208.185 99,8% -10 1,599 1,5981 S 82-4 2,607 9.855 8.451 56.739.179 9.956.354 99,9% 1,5967 Mittel 2,646 9.304 7.511 45.472.311 10.630.752 0,0013 Stabw. 0,0767 1537,9 797,7 10724638,2 1723247,5 0,08% Var.-K. 2,90% 16,53% 10,62% 23,58% 16,21% 1,8169 S 14-6 3,758 9.324,4 2.802,9 52.542.456,0 13.208.255,8 99,4% 1,8230 S 15-1 3,374 6.644,7 2.774,4 36.303.995,7 9.679.277,8 99,3% -10 1,827 Mittel 3,566 7.985 2.786 44.423.226 11.443.767 Stabw. 0,2711 1.894,8 20,1 11.482.325,4 2.495.364,2 Var.-K. 7,60% 23,73% 0,72% 25,85% 21,81% -10 1,286 1,2830 S102-4 2,991 8.785 9.803 81.268.323 21.553.650 99,2% 2,284 2,2646 S 11-5 3,531 8.231 2.667 53.985.244 6.030.174 99,5% 202
Tabelle A8-3: Ergebnisse der Retardationsversuche – SMA 0/11 S (I), +5°C Tabelle A8-4: Ergebnisse der Retardationsversuche – SMA 0/11 S (I), +20°C Temperatur σ [MPa] PK Spannung V m Burgers-Anpassung T [°C] Soll Ist [%] E 1 E 2 λ 1 λ 2 β 0,2753 s77-2 2,991 1.394,1 519,8 6.331.300,0 2.555.699,7 99,9% 0,2760 s81-5 2,991 968,2 463,4 7.101.000,0 2.101.399,5 99,9% 0,2765 s80-1 2,991 1.224,2 509,5 7.101.000,0 2.101.399,6 99,9% +5 0,28 0,2777 s79-1 3,067 1.676,1 521,3 7.256.500,0 2.452.899,6 99,9% 0,2764 Mittel 3,010 1.316 503 6.947.450 2.302.850 0,0010 Stabw. 0,0383 297,3 27,2 417256,1 236370,1 0,37% Var.-K. 1,27% 22,60% 5,40% 6,01% 10,26% 0,4146 s14-3 3,758 1.278,1 622,3 3.607.400,6 2.066.698,7 100,0% 0,4156 s105-2 3,374 1.490,4 554,1 5.957.933,9 1.753.022,6 99,9% +5 0,419 0,4168 s13-6 3,259 543,6 476,5 3.984.000,0 1.755.297,0 100,0% 0,4157 Mittel 3,464 1.104 551 4.516.445 1.858.339 0,0011 Stabw. 0,2610 496,8 73,0 1262487,5 180448,0 0,26% Var.-K. 7,54% 45,00% 13,25% 27,95% 9,71% 0,4984 s36-6 2,991 1.655,9 656,0 3.277.998,0 1.493.599,5 100,0% 0,4995 s82-5 2,607 1.017,8 648,6 3.478.213,9 1.484.750,2 99,9% +5 0,503 0,5001 s31-1 2,722 2.733,6 714,3 2.446.908,4 1.064.891,0 100,0% 0,4993 Mittel 2,774 1.802 673 3.067.707 1.347.747 0,0009 Stabw. 0,1968 867,2 36,0 546867,9 245000,4 0,17% Var.-K. 7,09% 48,12% 5,35% 17,83% 18,18% +5 0,59 0,5550 S31-3 1.457,9 740,0 2.446.909,6 1.064.885,0 99,9% 0,615 0,5970 S12-5 832,6 80,3 2.013.949,9 1.015.505,8 99,2% Temperatur σ [MPa] PK Spannung V m Burgers-Anpassung T [°C] Soll Ist [%] E 1 E 2 λ 1 λ 2 β 0,0658 S 77-4 2,991 149 39 723.240 209.500 99,9% 0,0665 S103-2 2,991 160 60 857.210 277.340 99,9% 0,0671 S 82-6 2,991 201 51 857.210 277.340 99,9% +20 0,071 0,0684 S 78-4 2,837 200 35 543.680 173.950 99,9% 0,0670 Mittel 2,9525 177 46 745.335 234.532 0,0011 Stabw. 0,0767 26,8 11,3 148.531,7 51.516,4 1,64% Var.-K. 2,60% 15,11% 24,45% 19,93% 21,97% 0,0857 S 32-3 3,363 167 38 575.100 186.580 99,9% 0,0836 S 79-2 3,374 137 34 495.102 176.682 100,0% 0,0849 S 105-1 3,374 106 28 541.267 248.801 99,9% +20 0,089 0,0850 S 77-6 3,374 144 39 564.760 181.670 99,9% 0,0857 S 32-1 2,991 147 40 409.327 154.423 100,0% 0,0850 Mittel 3,2952 140 36 517111 189631 0,0009 Stabw. 0,170 22,0 5,1 67.672,7 35.288,4 1,00% Var.-K. 5,17% 15,67% 14,19% 13,09% 18,61% 0,1014 S 81-1 2,991 161 37 462.628 180.751 100,0% 0,1023 S 104-4 2,991 186 58 823.587 262.293 99,9% 0,1027 S 78-1 2,991 154 39 466.885 183.412 100,0% +20 0,107 0,1036 S 79-3 3,106 269 48 612.670 213.380 99,9% 0,1025 Mittel 3,0196 192 45 591.442 209.959 0,0009 Stabw. 0,0575 52,8 9,5 169.754,1 37.896,3 0,89% Var.-K. 1,90% 27,43% 20,96% 28,70% 18,05% 203
- Seite 1:
Dimensionierungsrelevante Prognose
- Seite 4 und 5:
Abstract The resistance against fat
- Seite 6 und 7:
und Herrn Dr.-Ing. Markus Oeser mö
- Seite 8 und 9:
3.4.3 Versuchsergebnisse...........
- Seite 10 und 11:
werden konnten, im Vorfeld der Baum
- Seite 12 und 13:
Zunächst wird in Kapitel 4 der Ein
- Seite 14 und 15:
Als Bindemittel kommt Bitumen zum E
- Seite 16 und 17:
Wegmesseinrichtungen gemessen werde
- Seite 18 und 19:
2.4 Rheologie von Asphalt 2.4.1 Rhe
- Seite 20 und 21:
2.4.1.5 Voigt-Kelvin-Modell Das Voi
- Seite 22 und 23:
2.4.3 Reaktion rheologischer Modell
- Seite 24 und 25:
E Dämpfer σa σa = = ε σ a a =
- Seite 26 und 27:
2.4.3.5 Dehnungsfunktion des Voigt-
- Seite 28 und 29:
0,0040 0,0035 Dehnung ε [-] 0,0030
- Seite 30 und 31:
eignet sich für die Ermittlung des
- Seite 32 und 33:
Energie dissipiert als zu Beginn de
- Seite 34 und 35:
Phase I Phase II Phase III Dreiphas
- Seite 36 und 37:
der Dehnungsreaktion des Asphaltes,
- Seite 38 und 39:
Bodin [9] wählt zur Berechnung der
- Seite 40 und 41:
Tabelle 3.1: Zusammensetzung der un
- Seite 42 und 43:
Abbildung 3-2 Tabelle 3.2: Asphalta
- Seite 44 und 45:
Die Differenz aus der Zugfestigkeit
- Seite 46 und 47:
weisen die Probekörper aus ABi 0/1
- Seite 48 und 49:
Die während der Belastung gemessen
- Seite 50 und 51:
such bei der Prüftemperatur des Zu
- Seite 52 und 53:
mungen des Probekörpers zu ermitte
- Seite 54 und 55:
absoluten E-Modul beobachtet werden
- Seite 56 und 57:
Energy Ratio ER 25.000 Energy Ratio
- Seite 58 und 59:
N Makro C 1 C 2 el,100 = ⋅ ε Gle
- Seite 60 und 61:
4 Auswirkungen der Materialermüdun
- Seite 62 und 63:
Tabelle 4.1: Parameter K 1 , K 2 ,
- Seite 64 und 65:
100.000 100.000 Versuchsdauer bis M
- Seite 66 und 67:
-10 Exponent K 2 -9 -8 -7 -6 -5 -4
- Seite 68 und 69:
Die in Abbildung 4-6 dargestellten
- Seite 70 und 71:
Den Einfluss der Bindemittelviskosi
- Seite 72 und 73:
Bei einer Belastungsfrequenz von f
- Seite 74 und 75:
Abbildung 4-11: Vergleich der mitte
- Seite 76 und 77:
10.000.000 y = 1,4876x 0,9602 R 2 =
- Seite 78 und 79:
Mit Dehnungsabhängigen Ermüdungsk
- Seite 80 und 81:
Bei den in [24] untersuchten Asphal
- Seite 82 und 83:
1. Ermittlung der ertragbaren Lastw
- Seite 84 und 85:
Tabelle 5.1: SMA 0/11 S (I) SMA 0/1
- Seite 86 und 87:
5.2 Temperatur-Frequenz-Äquivalenz
- Seite 88 und 89:
deutlichen Unterschiede des absolut
- Seite 90 und 91:
0,50 0,45 0,40 0,35 SMA 0/11 S (I)
- Seite 92 und 93:
Tabelle 5.3: Temperatur T [°C] SMA
- Seite 94 und 95:
ähnliche Verläufe, wie der rechte
- Seite 96 und 97:
denen Frequenzen offensichtlich all
- Seite 98 und 99:
Abbildung 6-4 zeigt die Mittelwerte
- Seite 100 und 101:
Durch Fehlerquadratminimierung kön
- Seite 102 und 103:
Dieser Zusammenhang kann auch für
- Seite 104 und 105:
Auch die Faktoren b i , die die Abh
- Seite 106 und 107:
der Spannung, zu einer Zunahme der
- Seite 108 und 109:
erfolgen. Für Temperaturen, bei de
- Seite 110 und 111:
ε Burgers E ⎛ 2 ( σm ) − ⋅t
- Seite 112 und 113:
ε i = ε E ,i 1 σ = E i 1,i + ε
- Seite 114 und 115:
akkumulierte bleibende Dehnung εak
- Seite 116 und 117:
0,02 Dehnung ε [-] 0,018 0,016 0,0
- Seite 118 und 119:
6.5 Schlussfolgerung Mit Hilfe des
- Seite 120 und 121:
Bei einer Belastungsfrequenz von f
- Seite 122 und 123:
die Ermittlung der vier benötigten
- Seite 124 und 125:
Literatur [1] Arand, W.; Rubach, C.
- Seite 126 und 127:
[19] Hopman, P.; Kunst, P.; Pronk,
- Seite 128 und 129:
[38] Wistuba, M.; Lackner, R.; Blab
- Seite 130 und 131:
S 1 Koeffizient der Funktion zur Be
- Seite 132 und 133:
Abbildung 3.5: Prozentualer Anteil
- Seite 134 und 135:
Abbildung 5.4 Ermittlung der Steigu
- Seite 136 und 137:
Abbildung 6.17 Abbildung 7.1: Abbil
- Seite 138 und 139:
138
- Seite 140 und 141:
140
- Seite 142 und 143:
Tabelle A1-2: Ergebnisse der Zug- u
- Seite 144 und 145:
Tabelle A1-4: Ergebnisse der Zug- u
- Seite 146 und 147:
Tabelle A1-6: Ergebnisse der Zug- u
- Seite 148 und 149:
Tabelle A2-2: Ergebnisse der Einaxi
- Seite 150 und 151:
Tabelle A2-4: Ergebnisse der Einaxi
- Seite 152 und 153: A 2.3 Ergebnisse: AB 0/11 S Tabelle
- Seite 154 und 155: Tabelle A2-8: Ergebnisse der Einaxi
- Seite 156 und 157: A 2.4 Ergebnisse: OPA 0/8 Tabelle A
- Seite 158 und 159: Tabelle A2-12: Ergebnisse der Einax
- Seite 160 und 161: A 3 Ermüdungsfunktionen A 3.1 Erm
- Seite 162 und 163: Bis zum Makroriss ertragene Lastwec
- Seite 164 und 165: A 3.2 Ermüdungsfunktionen: SMA 0/1
- Seite 166 und 167: Bis zum Makroriss ertragene Lastwec
- Seite 168 und 169: A 3.4 Ermüdungsfunktionen: OPA 0/8
- Seite 170 und 171: Bis zum Makroriss ertragene Lastwec
- Seite 172 und 173: Bis zum Makroriss ertragene Lastwec
- Seite 174 und 175: A 3.6 Ermüdungsfunktionen: ATS 0/3
- Seite 176 und 177: 10.000.000 Bei einer Belastungsfreq
- Seite 178 und 179: 1.000.000 Prognostizierte Lastwechs
- Seite 180 und 181: 1.000.000 Prognostizierte Lastwechs
- Seite 182 und 183: Abbildung A6-3: Abhängigkeit der A
- Seite 184 und 185: A 6.2 Zeitliche Verläufe der relat
- Seite 186 und 187: Abbildung A6-11: Zeitliche Entwickl
- Seite 188 und 189: Abbildung A6-15: Zeitliche Entwickl
- Seite 190 und 191: Absoluter E-Modul |E| [MPa] 18000 1
- Seite 192 und 193: 6 SMA 0/11 S (I) 0°C 10 Hz; 1,0 MP
- Seite 194 und 195: A 7.3 Akkumulierte bleibende Dehnun
- Seite 196 und 197: A 7.4 Akkumulierte bleibende Dehnun
- Seite 198 und 199: 5 AB 0/16 S (I) -5°C 10 Hz; 1,0 MP
- Seite 200 und 201: A 7.6 Akkumulierte bleibende Dehnun
- Seite 204 und 205: 10.000 9.000 SMA 0/11 S (II) +20°C
- Seite 206 und 207: Tabelle A8-7: Ergebnisse der Retard
- Seite 208 und 209: 18.000 16.000 AB 0/11 S +20°C 0,09
- Seite 210 und 211: Tabelle A8-12: Ergebnisse der Retar
- Seite 212 und 213: Tabelle A8-14: Ergebnisse der Retar
- Seite 214 und 215: 16.000 14.000 ABi 0/16 S (I) +20°C
- Seite 216 und 217: Tabelle A8-20: Ergebnisse der Retar
- Seite 218 und 219: Tabelle A8-22: Ergebnisse der Retar
- Seite 220 und 221: A 8.2 Temperaturabhängigkeit der R
- Seite 222 und 223: Konstante a λ2 10 9 8 7 6 5 4 3 2
- Seite 224: Dehnung ε [-] 0,01 0,009 0,008 0,0