- Page 1 and 2:
2009 Performance Accountability Rep
- Page 3 and 4:
COMMUNITY COLLEGES 1
- Page 5 and 6:
Corporate Headquarters building adj
- Page 7 and 8:
to improve this measure. Enrollment
- Page 9 and 10:
government or industry-required cer
- Page 11 and 12:
JumpStart - Creating a Pathway to S
- Page 13 and 14:
Articulation Agreement with Potomac
- Page 15 and 16:
preparing direct mail pieces for bu
- Page 17 and 18:
ALLEGANY COLLEGE OF MARYLAND 2009 A
- Page 19 and 20:
ALLEGANY COLLEGE OF MARYLAND 2009 A
- Page 21 and 22:
ANNE ARUNDEL COMMUNITY COLLEGE MISS
- Page 23 and 24:
eceiving a GPA of zero declined for
- Page 25 and 26:
The number of minority students att
- Page 27 and 28:
graduates are prepared to enter the
- Page 29 and 30:
Student examinees registered to dat
- Page 31 and 32:
published in the local and Baltimor
- Page 33 and 34:
ANNE ARUNDEL COMMUNITY COLLEGE 2009
- Page 35 and 36:
ANNE ARUNDEL COMMUNITY COLLEGE 2009
- Page 37 and 38:
BALTIMORE CITY COMMUNITY COLLEGE MI
- Page 39 and 40:
usiness community it says BCCC is w
- Page 41 and 42:
income, first-generation college st
- Page 43 and 44:
the job market; contributes to acce
- Page 45 and 46:
them. Our establishment of the Mary
- Page 47 and 48:
literacy training with 130 free or
- Page 49 and 50:
COST CONTAINMENT Significant cost c
- Page 51 and 52:
BALTIMORE CITY COMMUNITY COLLEGE 20
- Page 53 and 54:
BALTIMORE CITY COMMUNITY COLLEGE 20
- Page 55 and 56:
Since inception, Carroll Community
- Page 57 and 58:
Providing Affordable Higher Educati
- Page 59 and 60:
variety of computer training course
- Page 61 and 62:
to engage students, make science ac
- Page 63 and 64:
CARROLL COMMUNITY COLLEGE 2009 ACCO
- Page 65 and 66:
CARROLL COMMUNITY COLLEGE 2009 ACCO
- Page 67 and 68:
Cecil College 2009 Institutional Pe
- Page 69 and 70:
now able to access information and
- Page 71 and 72:
earned college credit and/or indust
- Page 73 and 74:
skills and literacy (indicator #30)
- Page 75 and 76:
Cost Containment FY 2009 Significan
- Page 77 and 78:
14 16 CECIL COLLEGE 2009 ACCOUNTABI
- Page 79 and 80:
CECIL COLLEGE 2009 ACCOUNTABILITY R
- Page 81 and 82:
egistrations. The college was one o
- Page 83 and 84:
programs; thirty percent are in tra
- Page 85 and 86:
Diversity Chesapeake College embrac
- Page 87 and 88:
Due to repackaging of courses in no
- Page 89 and 90:
Community Partnerships The college
- Page 91 and 92:
COST CONTAINMENT Chesapeake College
- Page 93 and 94:
14 CHESAPEAKE COLLEGE 2009 ACCOUNTA
- Page 95 and 96:
CHESAPEAKE COLLEGE 2009 ACCOUNTABIL
- Page 97 and 98:
As of 2008 CCBC is close to meeting
- Page 99 and 100:
Student Satisfaction, Progress and
- Page 101 and 102:
Diversity CCBC is proud of its abil
- Page 103 and 104:
CCBC expects that the number of cou
- Page 105 and 106:
CCBC continued to expand its credit
- Page 107 and 108:
A reduction in Utility Consumption
- Page 109 and 110:
THE COMMUNITY COLLEGE OF BALTIMORE
- Page 111 and 112:
THE COMMUNITY COLLEGE OF BALTIMORE
- Page 113 and 114:
Affordability indicators except the
- Page 115 and 116:
additional opportunities between th
- Page 117 and 118:
needs in Frederick County and the s
- Page 119 and 120:
The College’s staff take communit
- Page 121 and 122:
3. ACCOUNTABILITY INDICATORS Includ
- Page 123 and 124:
FREDERICK COMMUNITY COLLEGE 2009 AC
- Page 125 and 126:
FREDERICK COMMUNITY COLLEGE 2009 AC
- Page 127 and 128:
and fees, financial aid and scholar
- Page 129 and 130:
The State Plan recommends increased
- Page 131 and 132:
Diversity Goal 3 of the 2004 Maryla
- Page 133 and 134:
enchmark.) Annual course enrollment
- Page 135 and 136:
lived with families in the communit
- Page 137 and 138:
Student Characteristics (not Benchm
- Page 139 and 140:
GARRETT COLLEGE 2009 ACCOUNTABILITY
- Page 141 and 142:
HAGERSTOWN COMMUNITY COLLEGE MISSIO
- Page 143 and 144:
community college students and thei
- Page 145 and 146:
Explanation Required Response to Co
- Page 147 and 148:
ACCOUNTABILITY INDICATORS The accou
- Page 149 and 150:
HAGERSTOWN COMMUNITY COLLEGE 2009 A
- Page 151 and 152:
HAGERSTOWN COMMUNITY COLLEGE 2009 A
- Page 153 and 154:
eturn affects the quality of the da
- Page 155 and 156:
To help alleviate the nursing short
- Page 157 and 158:
Institute and was one of three comm
- Page 159 and 160:
HARFORD COMMUNITY COLLEGE 2009 ACCO
- Page 161 and 162:
Community Outreach and Impact HARFO
- Page 163 and 164:
problem at HCC. The college offers
- Page 165 and 166:
usiness training. The college’s b
- Page 167 and 168:
out-of-state institutions and conti
- Page 169 and 170:
Explanation Required Response to Co
- Page 171 and 172:
HCC will use funds awarded by the N
- Page 173 and 174:
Section 5: Funding Issues Significa
- Page 175 and 176:
HOWARD COMMUNITY COLLEGE 2009 ACCOU
- Page 177 and 178:
HOWARD COMMUNITY COLLEGE 2009 ACCOU
- Page 179 and 180:
Degree Progress Model Students enro
- Page 181 and 182:
Academic Performance and Goal Achie
- Page 183 and 184:
Credit Enrollment Montgomery Colleg
- Page 185 and 186:
increased to 28.6 percent in fall 2
- Page 187 and 188:
Public Schools, Montgomery College,
- Page 189 and 190:
Significant Cost Containment Action
- Page 191 and 192:
MONTGOMERY COLLEGE 2009 ACCOUNTABIL
- Page 193 and 194:
MONTGOMERY COLLEGE 2009 ACCOUNTABIL
- Page 195 and 196:
communicating the state of the coll
- Page 197 and 198:
last year. Specific operational imp
- Page 199 and 200:
driver education programs and to th
- Page 201 and 202:
cohorts when measured by percentage
- Page 203 and 204:
2008 headcount. The improving enrol
- Page 205 and 206:
seeking credit students were enroll
- Page 207 and 208:
Community Outreach and Impact Princ
- Page 209 and 210:
software; Workforce Development and
- Page 211 and 212:
14 16 PRINCE GEORGE'S COMMUNITY COL
- Page 213 and 214:
PRINCE GEORGE'S COMMUNITY COLLEGE 2
- Page 215 and 216:
Occupational Program Associate Degr
- Page 217 and 218:
every effort to provide access by k
- Page 219 and 220:
As an indication of CSM’s commitm
- Page 221 and 222:
The CSM Energetics cohort that was
- Page 223 and 224:
Student Characteristics (not Benchm
- Page 225 and 226:
COLLEGE OF SOUTHERN MARYLAND 2009 A
- Page 227 and 228:
WOR-WIC COMMUNITY COLLEGE MISSION W
- Page 229 and 230:
The successful-persister rate for t
- Page 231 and 232:
Supporting the State Plan action re
- Page 233 and 234:
180. An increase to 129 occurred in
- Page 235 and 236:
The college has partnered with the
- Page 237 and 238:
13. Used a National Joint Powers Al
- Page 239 and 240:
14 WOR-WIC COMMUNITY COLLEGE 2009 A
- Page 241 and 242:
WOR-WIC COMMUNITY COLLEGE 2009 ACCO
- Page 243 and 244:
BOWIE STATE UNIVERSITY MISSION Bowi
- Page 245 and 246:
KEY GOALS, OBJECTIVES, AND PERFORMA
- Page 247 and 248:
GOAL 4: ENHANCE INCOME FROM EXTERNA
- Page 249 and 250:
information is underreported since
- Page 251 and 252:
FY 2009 COST CONTAINMENT EFFORTS Fo
- Page 253 and 254:
actuals per MSDE) 5 Input Number of
- Page 255 and 256:
COPPIN STATE UNIVERSITY MISSION A c
- Page 257 and 258:
Progress Made A critical mission of
- Page 259 and 260:
Progress Made Coppin’s second-yea
- Page 261 and 262:
Performance measures for this goal
- Page 263 and 264:
percent less expensive than the sta
- Page 265 and 266:
In FY 2008, Coppin’s second-year
- Page 267 and 268:
KEY GOALS AND OBJECTIVES Goal 1: Pr
- Page 269 and 270:
($000’s) 6,7 Outcome Ratio of med
- Page 271 and 272:
Performance Measures Input Total nu
- Page 273 and 274:
FROSTBURG STATE UNIVERSITY INSTITUT
- Page 275 and 276:
Computer Information Systems, have
- Page 277 and 278:
course sections were offered in the
- Page 279 and 280:
Goal 5: Increase recognition for th
- Page 281 and 282:
Approximately 70% of FSU’s teache
- Page 283 and 284:
KEY GOALS AND OBJECTIVES Goal 1: Se
- Page 285 and 286:
Objective 4.1: Attain greater facul
- Page 287 and 288:
Note: 1 Cumulative number of initia
- Page 289 and 290:
Kiplinger’s Personal Finance maga
- Page 291 and 292:
Organizations to support a diverse
- Page 293 and 294:
By providing additional academic as
- Page 295 and 296:
approximately 7,275 applications we
- Page 297 and 298:
In the past ten years, the nursing
- Page 299 and 300:
Salisbury University continues its
- Page 301 and 302:
Goal 2. Utilize strategic collabora
- Page 303 and 304:
through 2009. 2006 2007 2008 2009 P
- Page 305 and 306:
TOWSON UNIVERSITY MISSION Towson Un
- Page 307 and 308:
eligible students. The University c
- Page 309 and 310:
With the Community College of Balti
- Page 311 and 312:
eleases, saving $11,000, were imple
- Page 313 and 314:
It should also be noted that the nu
- Page 315 and 316:
KEY GOALS AND OBJECTIVES Goal 1: Cr
- Page 317 and 318:
Goal 2: Promote economic developmen
- Page 319 and 320:
Objective 4.4 Maintain the level of
- Page 321 and 322:
Baltimore does not offer any progra
- Page 323 and 324:
FY 2009 Funding Issues and Cost Con
- Page 325 and 326:
Objective 2.4 By FY 2009, expand th
- Page 327 and 328:
UNIVERSITY OF MARYLAND EASTERN SHOR
- Page 329 and 330:
2008-2009 academic year, these incl
- Page 331 and 332:
enroll at UMES, they matriculate in
- Page 333 and 334:
UMES continues to review its GPA re
- Page 335 and 336:
Enrollment in Distance Education an
- Page 337 and 338:
Summary The University of Maryland
- Page 339 and 340:
Objective 3.1 Increase the total nu
- Page 341 and 342:
UNIVERSITY OF MARYLAND, UNIVERSITY
- Page 343 and 344:
MHEC Goal 2: Achieve a system of po
- Page 345 and 346:
MHEC Goal 5: Promote economic growt
- Page 347 and 348:
MHEC included this comment in last
- Page 349 and 350:
Actual Actual Actual Actual Quality
- Page 351 and 352:
ST. MARY’S COLLEGE OF MARYLAND MI
- Page 353 and 354:
of graduating seniors rating health
- Page 355 and 356:
KEY GOALS AND OBJECTIVES Note: Unle
- Page 357 and 358:
Objective 2.3 Between 2005 and 2009
- Page 359 and 360:
Output Four-year graduation rate at
- Page 361 and 362:
Goal 7: Increase access for student
- Page 363 and 364:
Outcome Recycling rate for solid wa
- Page 365 and 366:
UNIVERSITY OF MARYLAND, BALTIMORE M
- Page 367 and 368:
through surveys sent to deans, admi
- Page 369 and 370:
implemented a 21 st century oral he
- Page 371 and 372:
RESPONSE TO ISSUES/QUESTIONS RAISED
- Page 373 and 374: KEY GOALS AND OBJECTIVES Goal 1: Ev
- Page 375 and 376: Objective 3.3 By fiscal year 2010 m
- Page 377 and 378: UNIVERSITY OF MARYLAND, BALTIMORE C
- Page 379 and 380: Engineering Society (AES) Conferenc
- Page 381 and 382: vs. 66.3% (see Objectives 4.3 and 5
- Page 383 and 384: 1970s are now reaching retirement a
- Page 385 and 386: Total Efficiency Efforts $3,060 UMB
- Page 387 and 388: Objective 2.2 Increase the estimate
- Page 389 and 390: Objective 5.3 Increase the number o
- Page 391 and 392: UNIVERSITY OF MARYLAND 2009 Institu
- Page 393 and 394: Maryland Transfer Advantage Program
- Page 395 and 396: The University’s Strategic Plan a
- Page 397 and 398: Local Economic Development. The Uni
- Page 399 and 400: Explanation Required Response to Co
- Page 401 and 402: decline in teacher enrollment at th
- Page 403 and 404: Objective 2.2 Increase the average
- Page 405 and 406: Objective 2.13 Increase the six-yea
- Page 407 and 408: Objective 5.5 Maintain the percenta
- Page 409 and 410: choice for the children, grandchild
- Page 411 and 412: places emphasis on attracting and r
- Page 413 and 414: financial aid packages that would m
- Page 415 and 416: ACCOUNTABILITY GOALS, OBJECTIVES AN
- Page 417 and 418: Percent of degrees awarded to Afric
- Page 419 and 420: Objective 6.3 Maintain the percenta
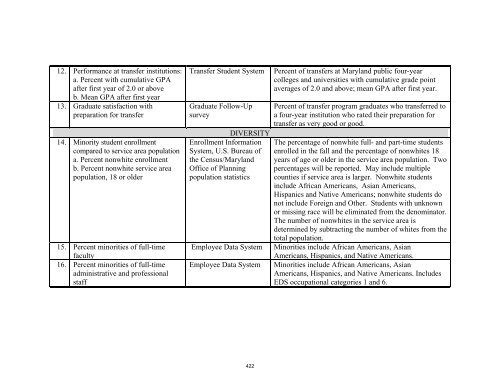
- Page 421 and 422: MISSION/ MANDATE PERFORMANCE INDICA
- Page 423: QUALITY AND EFFECTIVENESS: STUDENT
- Page 427 and 428: 28. Employer satisfaction with cont
- Page 429 and 430: FY 08: Fall 01 cohort FY 09: Fall 0
- Page 431 and 432: FY 10: Fall 09 (est) FY 11: Fall 10
- Page 433 and 434: Coppin State University MFR 2009 OP
- Page 435 and 436: Coppin State University MFR 2009 OP
- Page 437 and 438: Coppin State University MFR 2009 OP
- Page 439 and 440: Coppin State University MFR 2009 OP
- Page 441 and 442: Coppin State University MFR 2009 OP
- Page 443 and 444: Coppin State University MFR 2009 OP
- Page 445 and 446: RB26.00 FROSTBURG STATE UNIVERSITY
- Page 447 and 448: RB26.00 FROSTBURG STATE UNIVERSITY
- Page 449 and 450: RB26.00 FROSTBURG STATE UNIVERSITY
- Page 451 and 452: RB26.00 FROSTBURG STATE UNIVERSITY
- Page 453 and 454: RB26.00 FROSTBURG STATE UNIVERSITY
- Page 455 and 456: RB26.00 FROSTBURG STATE UNIVERSITY
- Page 457 and 458: RB26.00 FROSTBURG STATE UNIVERSITY
- Page 459 and 460: Template Objective Salisbury Univer
- Page 461 and 462: Template Objective Salisbury Univer
- Page 463 and 464: Template Objective Salisbury Univer
- Page 465 and 466: Template Objective Salisbury Univer
- Page 467 and 468: Template Objective SU USM Indicator
- Page 469 and 470: TOWSON UNIVERSITY - MFR 2008 OPERAT
- Page 471 and 472: TOWSON UNIVERSITY - MFR 2008 OPERAT
- Page 473 and 474: TOWSON UNIVERSITY - MFR 2008 OPERAT
- Page 475 and 476:
TOWSON UNIVERSITY - MFR 2008 OPERAT
- Page 477 and 478:
TOWSON UNIVERSITY - MFR 2008 OPERAT
- Page 479 and 480:
TOWSON UNIVERSITY - MFR 2008 OPERAT
- Page 481 and 482:
TOWSON UNIVERSITY - MFR 2008 OPERAT
- Page 483 and 484:
29 2005 Actual: graduates who took
- Page 485 and 486:
Est: Class of 2010 grads 33 Fiscal
- Page 487 and 488:
2005 Survey after graduation by tot
- Page 489 and 490:
2.4 Number of students enrolled in
- Page 491 and 492:
OUTPUTS 6 FY 09: Cohort of 2007 4.1
- Page 493 and 494:
9 FY 09: Cohort of 2002 4.4 Six-yea
- Page 495 and 496:
12 FY 09: Fall 08 Actual 2.1 Percen
- Page 497 and 498:
16 5.2 Funds received through fundr
- Page 499 and 500:
19 FY 08: Fall 06 + Spring 06 (ETS
- Page 501 and 502:
EFFICIENCY 22 FY 09: Fiscal Year 08
- Page 503 and 504:
June 27, 2008 - UMUC - Common + Ins
- Page 505 and 506:
June 27, 2008 - UMUC - Common + Ins
- Page 507 and 508:
June 27, 2008 - UMUC - Common + Ins
- Page 509 and 510:
OPERATIONAL DEFINITIONS FOR MFR/ACC
- Page 511 and 512:
OPERATIONAL DEFINITIONS FOR MFR/ACC
- Page 513 and 514:
OPERATIONAL DEFINITIONS FOR MFR/ACC
- Page 515 and 516:
Measure # Special Timeframe Issues
- Page 517 and 518:
Measure # Special Timeframe Issues
- Page 519 and 520:
OPERATIONAL DEFINITIONS FOR MFR/ACC
- Page 521 and 522:
9 FY 05: cohort of 2003 4.2 African
- Page 523 and 524:
19 FY 05: 2000 survey- 1999 bach de
- Page 525 and 526:
4/12/2010 UMBC MFR Operational Defi
- Page 527 and 528:
UNIVERSITY OF MARYLAND, COLLEGE PAR
- Page 529 and 530:
UNIVERSITY OF MARYLAND, COLLEGE PAR
- Page 531 and 532:
UNIVERSITY OF MARYLAND, COLLEGE PAR
- Page 533 and 534:
UNIVERSITY OF MARYLAND, COLLEGE PAR
- Page 535 and 536:
MORGAN STATE UNIVERSITY OPERATIONAL
- Page 537 and 538:
INDICATOR SOURCE OPERATIONAL DEFINI
- Page 539 and 540:
SUGGESTED GUIDELINES - BENCHMARKING
- Page 541 and 542:
INSTITUTIONAL PERFORMANCE ACCOUNTAB
- Page 543 and 544:
5. Cost Containment Significant cos
- Page 545:
4. Cost containment Significant cos