ABI Prism® 7900HT Sequence Detection System ... - OpenWetWare
ABI Prism® 7900HT Sequence Detection System ... - OpenWetWare
ABI Prism® 7900HT Sequence Detection System ... - OpenWetWare

Create successful ePaper yourself
Turn your PDF publications into a flip-book with our unique Google optimized e-Paper software.
Overview<br />
About Absolute<br />
Quantification<br />
Employing the<br />
5´ Nuclease Assay<br />
6-4 Real-Time Analysis<br />
The <strong>ABI</strong> PRISM <strong>7900HT</strong> <strong>Sequence</strong> <strong>Detection</strong> <strong>System</strong> supports real-time absolute<br />
quantification of nucleic acids using a standard curve method. The objective of<br />
absolute quantification is to accurately determine the absolute quantity of a single<br />
nucleic acid target sequence within an unknown sample. The results of an absolute<br />
quantification experiment are reported in the same unit measure of the standard used<br />
to make them.<br />
Absolute quantification on the <strong>7900HT</strong> instrument is accomplished through the use of<br />
the polymerase chain reaction and the fluorogenic 5´ nuclease assay (see page A-2).<br />
During setup, standards diluted over several orders of magnitude and unknown<br />
samples are loaded onto an <strong>ABI</strong> PRISM® Optical Reaction Plate containing master mix<br />
and TaqMan assays targeting a specific nucleic acid sequence. The plate is then<br />
loaded into a <strong>7900HT</strong> instrument which has been configured to perform a real-time<br />
run. During the thermal cycling, the instrument records the emission resulting from the<br />
cleavage of TaqMan® probes in the presence of the target sequence. After the run,<br />
the SDS software processes the raw fluorescence data to produce threshold<br />
cycle (C T ) values for each sample (see page A-10). The software then computes a<br />
standard curve from the C T values of the diluted standards and extrapolates absolute<br />
quantities for the unknown samples based on their C T values (see below).<br />
Note See Appendix A, “Theory of Operation,” for more information on the fluorogenic<br />
5´ nuclease assay, real-time data collection, or the mathematical transformations of sequence<br />
detection data.<br />
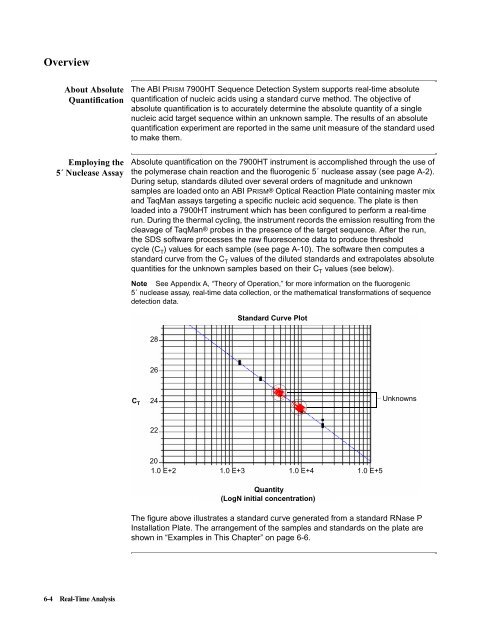
C T<br />
28<br />
26<br />
24<br />
22<br />
Standard Curve Plot<br />
20<br />
1.0 E+2 1.0 E+3 1.0 E+4 1.0 E+5<br />
Quantity<br />
(LogN initial concentration)<br />
Unknowns<br />
The figure above illustrates a standard curve generated from a standard RNase P<br />
Installation Plate. The arrangement of the samples and standards on the plate are<br />
shown in “Examples in This Chapter” on page 6-6.