ABI Prism® 7900HT Sequence Detection System ... - OpenWetWare
ABI Prism® 7900HT Sequence Detection System ... - OpenWetWare
ABI Prism® 7900HT Sequence Detection System ... - OpenWetWare

Create successful ePaper yourself
Turn your PDF publications into a flip-book with our unique Google optimized e-Paper software.
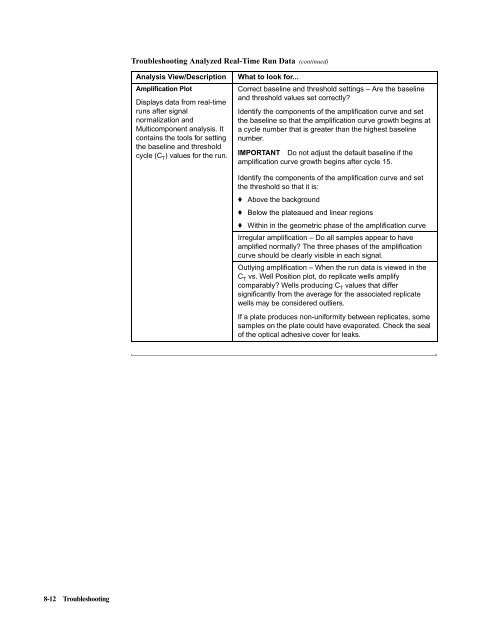
8-12 Troubleshooting<br />
Troubleshooting Analyzed Real-Time Run Data (continued)<br />
Analysis View/Description What to look for...<br />
Amplification Plot<br />
Displays data from real-time<br />
runs after signal<br />
normalization and<br />
Multicomponent analysis. It<br />
contains the tools for setting<br />
the baseline and threshold<br />
cycle (C T ) values for the run.<br />
Correct baseline and threshold settings – Are the baseline<br />
and threshold values set correctly?<br />
Identify the components of the amplification curve and set<br />
the baseline so that the amplification curve growth begins at<br />
a cycle number that is greater than the highest baseline<br />
number.<br />
IMPORTANT Do not adjust the default baseline if the<br />
amplification curve growth begins after cycle 15.<br />
Identify the components of the amplification curve and set<br />
the threshold so that it is:<br />
♦ Above the background<br />
♦ Below the plateaued and linear regions<br />
♦ Within in the geometric phase of the amplification curve<br />
Irregular amplification – Do all samples appear to have<br />
amplified normally? The three phases of the amplification<br />
curveshouldbeclearlyvisibleineachsignal.<br />
Outlying amplification – When the run data is viewed in the<br />
CT vs. Well Position plot, do replicate wells amplify<br />
comparably? Wells producing CT values that differ<br />
significantly from the average for the associated replicate<br />
wells may be considered outliers.<br />
If a plate produces non-uniformity between replicates, some<br />
samples on the plate could have evaporated. Check the seal<br />
of the optical adhesive cover for leaks.