ABI Prism® 7900HT Sequence Detection System ... - OpenWetWare
ABI Prism® 7900HT Sequence Detection System ... - OpenWetWare
ABI Prism® 7900HT Sequence Detection System ... - OpenWetWare

Create successful ePaper yourself
Turn your PDF publications into a flip-book with our unique Google optimized e-Paper software.
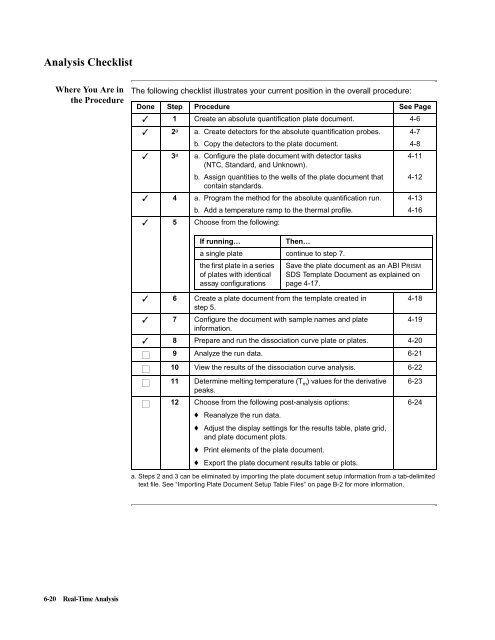
Analysis Checklist<br />
WhereYouArein<br />
the Procedure<br />
6-20 Real-Time Analysis<br />
The following checklist illustrates your current position in the overall procedure:<br />
Done Step Procedure See Page<br />
✓ 1 Create an absolute quantification plate document. 4-6<br />
✓ 2a a. Create detectors for the absolute quantification probes. 4-7<br />
b. Copy the detectors to the plate document. 4-8<br />
✓ 3a a. Configure the plate document with detector tasks<br />
(NTC, Standard, and Unknown).<br />
4-11<br />
b. Assign quantities to the wells of the plate document that<br />
contain standards.<br />
4-12<br />
✓ 4 a. Program the method for the absolute quantification run. 4-13<br />
b. Add a temperature ramp to the thermal profile. 4-16<br />
✓ 5 Choose from the following:<br />
If running… Then…<br />
a single plate continue to step 7.<br />
the first plate in a series Save the plate document as an <strong>ABI</strong> PRISM<br />
of plates with identical SDS Template Document as explained on<br />
assay configurations page 4-17.<br />
✓ 6 Create a plate document from the template created in<br />
step 5.<br />
✓ 7 Configure the document with sample names and plate<br />
information.<br />
a. Steps 2 and 3 can be eliminated by importing the plate document setup information from a tab-delimited<br />
text file. See “Importing Plate Document Setup Table Files” on page B-2 for more information.<br />
4-18<br />
4-19<br />
✓ 8 Prepare and run the dissociation curve plate or plates. 4-20<br />
9 Analyze the run data. 6-21<br />
10 View the results of the dissociation curve analysis. 6-22<br />
11 Determine melting temperature (Tm ) values for the derivative<br />
peaks.<br />
12 Choose from the following post-analysis options:<br />
♦ Reanalyze the run data.<br />
♦ Adjust the display settings for the results table, plate grid,<br />
and plate document plots.<br />
♦ Print elements of the plate document.<br />
♦ Export the plate document results table or plots.<br />
6-23<br />
6-24