ABI Prism® 7900HT Sequence Detection System ... - OpenWetWare
ABI Prism® 7900HT Sequence Detection System ... - OpenWetWare
ABI Prism® 7900HT Sequence Detection System ... - OpenWetWare

Create successful ePaper yourself
Turn your PDF publications into a flip-book with our unique Google optimized e-Paper software.
<strong>System</strong> Overview<br />
About the <strong>7900HT</strong><br />
Instrument<br />
Supported Runs and<br />
Chemistries<br />
2-2 Product Overview<br />
The <strong>ABI</strong> PRISM® <strong>7900HT</strong> <strong>Sequence</strong> <strong>Detection</strong> <strong>System</strong> is a second-generation<br />
sequence detection system instrument designed for automated, high-throughput<br />
detection of fluorescent PCR-related chemistries. The instrument is capable of<br />
real-time, end-point, and dissociation curve analysis of assays arrayed on multiple<br />
formats. The <strong>7900HT</strong> instrument is optimized for use with Applied Biosystems<br />
chemistries including those related to nucleic acid quantification and detection.<br />
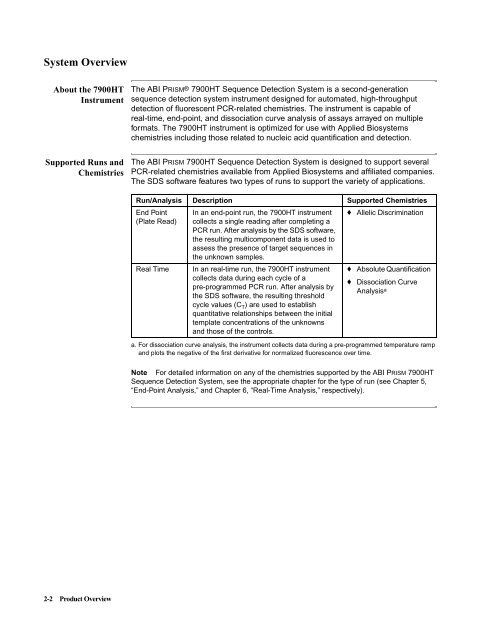
The <strong>ABI</strong> PRISM <strong>7900HT</strong> <strong>Sequence</strong> <strong>Detection</strong> <strong>System</strong> is designed to support several<br />
PCR-related chemistries available from Applied Biosystems and affiliated companies.<br />
The SDS software features two types of runs to support the variety of applications.<br />
Run/Analysis Description Supported Chemistries<br />
End Point<br />
(Plate Read)<br />
In an end-point run, the <strong>7900HT</strong> instrument<br />
collects a single reading after completing a<br />
PCR run. After analysis by the SDS software,<br />
the resulting multicomponent data is used to<br />
assess the presence of target sequences in<br />
the unknown samples.<br />
Real Time In an real-time run, the <strong>7900HT</strong> instrument<br />
collects data during each cycle of a<br />
pre-programmed PCR run. After analysis by<br />
the SDS software, the resulting threshold<br />
cycle values (C T) are used to establish<br />
quantitative relationships between the initial<br />
template concentrations of the unknowns<br />
and those of the controls.<br />
♦ Allelic Discrimination<br />
♦ Absolute Quantification<br />
♦ Dissociation Curve<br />
Analysisa a. For dissociation curve analysis, the instrument collects data during a pre-programmed temperature ramp<br />
and plots the negative of the first derivative for normalized fluorescence over time.<br />
Note For detailed information on any of the chemistries supported by the <strong>ABI</strong> PRISM <strong>7900HT</strong><br />
<strong>Sequence</strong> <strong>Detection</strong> <strong>System</strong>, see the appropriate chapter for the type of run (see Chapter 5,<br />
“End-Point Analysis,” and Chapter 6, “Real-Time Analysis,” respectively).