ABI Prism® 7900HT Sequence Detection System ... - OpenWetWare
ABI Prism® 7900HT Sequence Detection System ... - OpenWetWare
ABI Prism® 7900HT Sequence Detection System ... - OpenWetWare

Create successful ePaper yourself
Turn your PDF publications into a flip-book with our unique Google optimized e-Paper software.
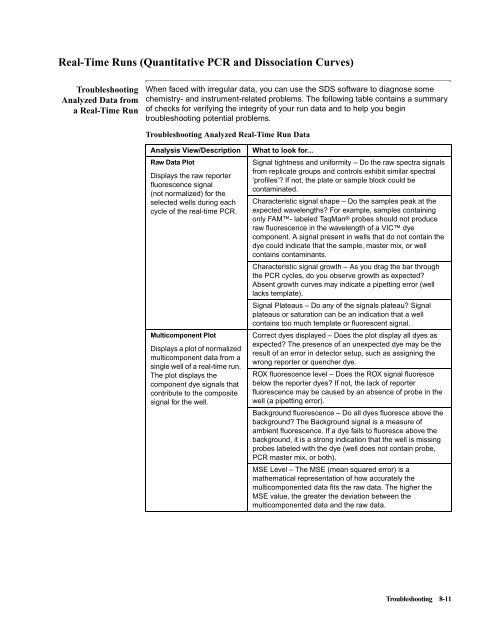
Real-Time Runs (Quantitative PCR and Dissociation Curves)<br />
Troubleshooting<br />
Analyzed Data from<br />
aReal-TimeRun<br />
When faced with irregular data, you can use the SDS software to diagnose some<br />
chemistry- and instrument-related problems. The following table contains a summary<br />
of checks for verifying the integrity of your run data and to help you begin<br />
troubleshooting potential problems.<br />
Troubleshooting Analyzed Real-Time Run Data<br />
Analysis View/Description What to look for...<br />
Raw Data Plot<br />
Signal tightness and uniformity – Do the raw spectra signals<br />
from replicate groups and controls exhibit similar spectral<br />
Displays the raw reporter<br />
‘profiles’? If not, the plate or sample block could be<br />
fluorescence signal<br />
contaminated.<br />
(not normalized) for the<br />
selected wells during each Characteristic signal shape – Do the samples peak at the<br />
cycle of the real-time PCR. expected wavelengths? For example, samples containing<br />
only FAM- labeled TaqMan® probes should not produce<br />
raw fluorescence in the wavelength of a VIC dye<br />
component. A signal present in wells that do not contain the<br />
dye could indicate that the sample, master mix, or well<br />
contains contaminants.<br />
Characteristic signal growth – As you drag the bar through<br />
the PCR cycles, do you observe growth as expected?<br />
Absent growth curves may indicate a pipetting error (well<br />
lacks template).<br />
Signal Plateaus – Do any of the signals plateau? Signal<br />
plateaus or saturation can be an indication that a well<br />
contains too much template or fluorescent signal.<br />
Multicomponent Plot<br />
Correct dyes displayed – Does the plot display all dyes as<br />
expected? The presence of an unexpected dye may be the<br />
Displays a plot of normalized<br />
result of an error in detector setup, such as assigning the<br />
multicomponent data from a<br />
wrong reporter or quencher dye.<br />
single well of a real-time run.<br />
The plot displays the ROX fluorescence level – Does the ROX signal fluoresce<br />
component dye signals that below the reporter dyes? If not, the lack of reporter<br />
contribute to the composite fluorescence may be caused by an absence of probe in the<br />
signal for the well.<br />
well (a pipetting error).<br />
Background fluorescence – Do all dyes fluoresce above the<br />
background? The Background signal is a measure of<br />
ambient fluorescence. If a dye fails to fluoresce above the<br />
background, it is a strong indication that the well is missing<br />
probes labeled with the dye (well does not contain probe,<br />
PCRmastermix,orboth).<br />
MSE Level – The MSE (mean squared error) is a<br />
mathematical representation of how accurately the<br />
multicomponented data fits the raw data. The higher the<br />
MSE value, the greater the deviation between the<br />
multicomponented data and the raw data.<br />
Troubleshooting 8-11