- Page 1 and 2:
ABI PRISM ® 7900HT Sequence Detect
- Page 3 and 4:
© Copyright 2001, Applied Biosyste
- Page 5 and 6:
iv Section:PlateDocumentSetup......
- Page 7 and 8:
vi A Theory of Operation Fluorescen
- Page 9 and 10:
Attention Words and Warning Labels
- Page 11 and 12:
About Waste Profiles A waste profil
- Page 13 and 14:
Safe Instrument Use Before Operatin
- Page 16 and 17:
Product Overview 2 In This Chapter
- Page 18 and 19:
Section: Getting to Know the Hardwa
- Page 20 and 21:
Interchangeable Thermal Cycler Bloc
- Page 22 and 23:
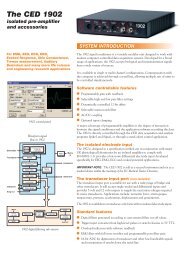
Computer Description The computer c
- Page 24 and 25:
Zymark Twister Microplate Handler D
- Page 26 and 27:
Instrument Connections Electrical C
- Page 28 and 29:
Section: Getting to Know the Softwa
- Page 30 and 31:
Managing Sequence Detection System
- Page 32 and 33:
Getting Started 3 In This Chapter T
- Page 34 and 35:
Using the SDS Software Online Help
- Page 36 and 37:
Turning on the ABI PRISM 7900HT Seq
- Page 38 and 39:
Using the SDS Software Workspace La
- Page 40 and 41:
Using the General Toolbar Using the
- Page 42 and 43:
Basic Software Skills Tutorial Abou
- Page 44 and 45:
Exercise 3: Opening a Plate Documen
- Page 46 and 47:
Lesson 2: Viewing and Resizing Pane
- Page 48 and 49:
Exercise 2: Selecting Multiple Well
- Page 50 and 51:
Lesson 4: Using the Hand-Held Bar C
- Page 52 and 53:
Using SDS Plate Documents Using Mul
- Page 54 and 55:
Run Setup and Basic Operation 4 In
- Page 56 and 57:
Setup Checklists Experiments/Runs P
- Page 58 and 59:
Section: Plate Document Setup In Th
- Page 60 and 61:
Step 2 - Applying Detectors and Mar
- Page 62 and 63: Creating an Allelic Discrimination
- Page 64 and 65: Step 3 - Configuring the Plate Docu
- Page 66 and 67: Step 4 - Programming the Plate Docu
- Page 68 and 69: To create a method for the absolute
- Page 70 and 71: Step 5 - Saving the Plate Document
- Page 72 and 73: Step 7 - Applying Sample and Plate
- Page 74 and 75: Section: Running an Individual Plat
- Page 76 and 77: Preparing and Running a Single Plat
- Page 78 and 79: Operating the 7900HT Instrument Usi
- Page 80 and 81: After the Run Analyzing the Run Dat
- Page 82 and 83: Section: Running Multiple Plates Us
- Page 84 and 85: Adding a Plate Document to the Plat
- Page 86 and 87: To create plate documents from a te
- Page 88 and 89: Adding Plates to the Plate Queue Re
- Page 90 and 91: Loading Plates To load plates onto
- Page 92 and 93: End-Point Analysis 5 In This Chapte
- Page 94 and 95: Section: Allelic Discrimination In
- Page 96 and 97: Algorithmic Manipulation of Raw All
- Page 98 and 99: Before You Begin Using SDS Online H
- Page 100 and 101: Analyzing a Completed Allelic Discr
- Page 102 and 103: Calling Allele Types To call allele
- Page 104 and 105: Scrutinizing the Allele Calls To an
- Page 106: After the Analysis Changing the Pla
- Page 109 and 110: Real-Time Runs on the 7900HT Instru
- Page 111: Overview About Absolute Quantificat
- Page 115 and 116: Analyzing the Run Data Configuring
- Page 117 and 118: Setting the Baseline and Threshold
- Page 119 and 120: Eliminating Outliers For any PCR, e
- Page 121 and 122: Viewing the Standard Curve 6-14 Rea
- Page 123 and 124: 6-16 Real-Time Analysis
- Page 125 and 126: Overview About Dissociation Curve A
- Page 127 and 128: Analysis Checklist WhereYouArein th
- Page 129 and 130: Determining T m Values for the Anal
- Page 131 and 132: After the Analysis Changing the Pla
- Page 133 and 134: Recommended Maintenance Schedule Ma
- Page 135 and 136: Replacing the Sample Block When to
- Page 137 and 138: 7-6 System Maintenance To remove th
- Page 139 and 140: 7-8 System Maintenance To replace t
- Page 141 and 142: 7-10 System Maintenance To replace
- Page 143 and 144: Cleaning the Sample Block Wells 7-1
- Page 145 and 146: Prepare a Background Plate Document
- Page 147 and 148: Extracting the Background 7-16 Syst
- Page 149 and 150: Materials Required The following ma
- Page 151 and 152: Extracting Pure Dye Information fro
- Page 153 and 154: Constructing a Custom Pure Dye Plat
- Page 155 and 156: Verifying Instrument Performance Us
- Page 157 and 158: Preparing and Running an RNase P Pl
- Page 159 and 160: Adjusting the Sensitivity of the Pl
- Page 161 and 162: Testing the Adjustment 7-30 System
- Page 163 and 164:
Aligning the Plate Handler When to
- Page 165 and 166:
7-34 System Maintenance To align th
- Page 167 and 168:
Re-checking the Input Stack 1 7-36
- Page 169 and 170:
Defining the Positions of the Remai
- Page 171 and 172:
Aligning the Fixed-Position Bar Cod
- Page 173 and 174:
7-42 System Maintenance To position
- Page 175 and 176:
7-44 System Maintenance
- Page 177 and 178:
General Computer Maintenance Mainte
- Page 179 and 180:
Maintaining the SDS software Admini
- Page 181 and 182:
Troubleshooting Table 8-2 Troublesh
- Page 183 and 184:
Low Precision or Irreproducibility
- Page 185 and 186:
Writing on the Reaction Plates Fluo
- Page 187 and 188:
Background Runs Background Troubles
- Page 189 and 190:
Pure Dye Runs Pure Dye Troubleshoot
- Page 191 and 192:
8-12 Troubleshooting Troubleshootin
- Page 193 and 194:
Software and 7900HT Instrument Trou
- Page 195 and 196:
8-16 Troubleshooting Troubleshootin
- Page 198:
User Bulletins 9 9 About This Chapt
- Page 201 and 202:
Fluorescent-Based Chemistries Funda
- Page 203 and 204:
Fluorescence Detection and Data Col
- Page 205 and 206:
Normalization of Reporter Signals A
- Page 207 and 208:
Determining Initial Template Concen
- Page 209 and 210:
Calculating Threshold Cycles A-10 T
- Page 212 and 213:
Importing and Exporting Plate Docum
- Page 214 and 215:
Configuring the Setup Table File wi
- Page 216 and 217:
About the Setup Table File Format S
- Page 218 and 219:
Setup Table Elements (continued) Nu
- Page 220 and 221:
Exporting Plate Document Data Expor
- Page 222 and 223:
Designing TaqMan Assays C In This A
- Page 224 and 225:
Design Probes and Primers The follo
- Page 226 and 227:
Design Tips for Allelic Discriminat
- Page 228 and 229:
Kits, Reagents and Consumables D In
- Page 230 and 231:
Consumables and Disposables The ABI
- Page 232:
TaqMan Pre-Developed Assays and Rea
- Page 236:
Contacting Technical Support F Serv
- Page 239 and 240:
G-2 Limited Warranty Statement No a
- Page 241 and 242:
A(continued) Automation Controller
- Page 243 and 244:
I(continued) installing plate adapt
- Page 245 and 246:
Q quantifying probes and primers C-
- Page 248 and 249:
Headquarters 850 Lincoln Centre Dri