ABI Prism® 7900HT Sequence Detection System ... - OpenWetWare
ABI Prism® 7900HT Sequence Detection System ... - OpenWetWare
ABI Prism® 7900HT Sequence Detection System ... - OpenWetWare

You also want an ePaper? Increase the reach of your titles
YUMPU automatically turns print PDFs into web optimized ePapers that Google loves.
Normalization of<br />
Reporter Signals<br />
A-6 Theory of Operation<br />
The software uses the pure dye spectra, generated as part of instrument calibration<br />
(see page 7-17), to solve for coefficients a, b, and c in the following equation:<br />
Measured spectrum = a( FAM)<br />
+ bVIC ( ) + cROX ( ) + d( Background)<br />
+ MSE<br />
where the coefficients a, b, and c represent each dye component’s contribution to the<br />
composite spectrum.<br />
Note The example calculation above assumes that pure dye components exist for three dyes<br />
(FAM,VIC,andROX) and for the instrument background.<br />
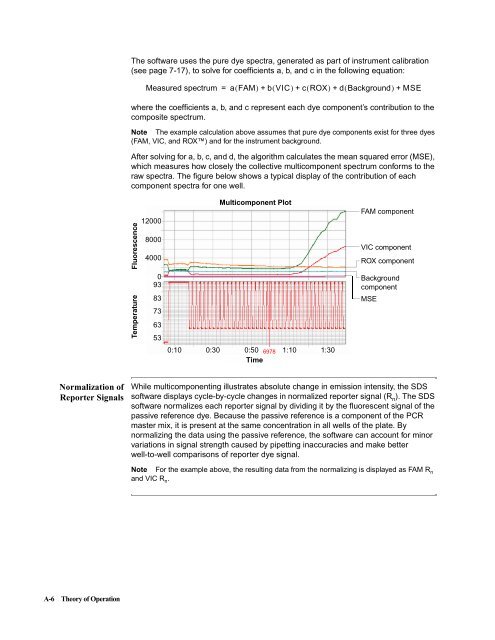
After solving for a, b, c, and d, the algorithm calculates the mean squared error (MSE),<br />
which measures how closely the collective multicomponent spectrum conforms to the<br />
raw spectra. The figure below shows a typical display of the contribution of each<br />
component spectra for one well.<br />
Fluorescence<br />
Temperature<br />
12000<br />
8000<br />
4000<br />
0<br />
93<br />
83<br />
73<br />
63<br />
53<br />
Multicomponent Plot<br />
0:10 0:30 0:50<br />
Time<br />
6978 1:10 1:30<br />
FAM component<br />
VIC component<br />
ROX component<br />
Background<br />
component<br />
MSE<br />
While multicomponenting illustrates absolute change in emission intensity, the SDS<br />
software displays cycle-by-cycle changes in normalized reporter signal (R n ). The SDS<br />
software normalizes each reporter signal by dividing it by the fluorescent signal of the<br />
passive reference dye. Because the passive reference is a component of the PCR<br />
master mix, it is present at the same concentration in all wells of the plate. By<br />
normalizing the data using the passive reference, the software can account for minor<br />
variations in signal strength caused by pipetting inaccuracies and make better<br />
well-to-well comparisons of reporter dye signal.<br />
Note For the example above, the resulting data from the normalizing is displayed as FAM R n<br />
and VIC R n .