ABI Prism® 7900HT Sequence Detection System ... - OpenWetWare
ABI Prism® 7900HT Sequence Detection System ... - OpenWetWare
ABI Prism® 7900HT Sequence Detection System ... - OpenWetWare

Create successful ePaper yourself
Turn your PDF publications into a flip-book with our unique Google optimized e-Paper software.
Low Precision or Irreproducibility<br />
Improper Threshold<br />
Setting<br />
8-4 Troubleshooting<br />
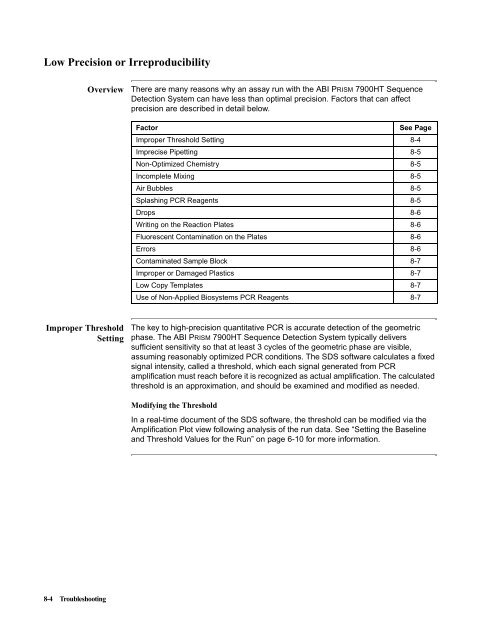
Overview There are many reasons why an assay run with the <strong>ABI</strong> PRISM <strong>7900HT</strong> <strong>Sequence</strong><br />
<strong>Detection</strong> <strong>System</strong> can have less than optimal precision. Factors that can affect<br />
precision are described in detail below.<br />
Factor See Page<br />
Improper Threshold Setting 8-4<br />
Imprecise Pipetting 8-5<br />
Non-Optimized Chemistry 8-5<br />
Incomplete Mixing 8-5<br />
Air Bubbles 8-5<br />
Splashing PCR Reagents 8-5<br />
Drops 8-6<br />
Writing on the Reaction Plates 8-6<br />
Fluorescent Contamination on the Plates 8-6<br />
Errors 8-6<br />
Contaminated Sample Block 8-7<br />
Improper or Damaged Plastics 8-7<br />
Low Copy Templates 8-7<br />
Use of Non-Applied Biosystems PCR Reagents 8-7<br />
The key to high-precision quantitative PCR is accurate detection of the geometric<br />
phase. The <strong>ABI</strong> PRISM <strong>7900HT</strong> <strong>Sequence</strong> <strong>Detection</strong> <strong>System</strong> typically delivers<br />
sufficient sensitivity so that at least 3 cycles of the geometric phase are visible,<br />
assuming reasonably optimized PCR conditions. The SDS software calculates a fixed<br />
signal intensity, called a threshold, which each signal generated from PCR<br />
amplification must reach before it is recognized as actual amplification. The calculated<br />
threshold is an approximation, and should be examined and modified as needed.<br />
Modifying the Threshold<br />
In a real-time document of the SDS software, the threshold can be modified via the<br />
Amplification Plot view following analysis of the run data. See “Setting the Baseline<br />
and Threshold Values for the Run” on page 6-10 for more information.