ABI Prism® 7900HT Sequence Detection System ... - OpenWetWare
ABI Prism® 7900HT Sequence Detection System ... - OpenWetWare
ABI Prism® 7900HT Sequence Detection System ... - OpenWetWare
Create successful ePaper yourself
Turn your PDF publications into a flip-book with our unique Google optimized e-Paper software.
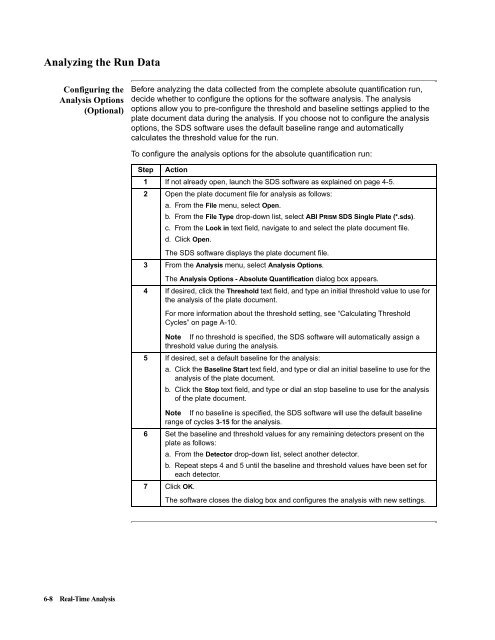
Analyzing the Run Data<br />
Configuring the<br />
Analysis Options<br />
(Optional)<br />
6-8 Real-Time Analysis<br />
Before analyzing the data collected from the complete absolute quantification run,<br />
decide whether to configure the options for the software analysis. The analysis<br />
options allow you to pre-configure the threshold and baseline settings applied to the<br />
plate document data during the analysis. If you choose not to configure the analysis<br />
options, the SDS software uses the default baseline range and automatically<br />
calculates the threshold value for the run.<br />
To configure the analysis options for the absolute quantification run:<br />
Step Action<br />
1 If not already open, launch the SDS software as explained on page 4-5.<br />
2 Open the plate document file for analysis as follows:<br />
a. From the File menu, select Open.<br />
b. From the File Type drop-down list, select <strong>ABI</strong> PRISM SDS Single Plate (*.sds).<br />
c. From the Look in text field, navigate to and select the plate document file.<br />
d. Click Open.<br />
The SDS software displays the plate document file.<br />
3 From the Analysis menu, select Analysis Options.<br />
The Analysis Options - Absolute Quantification dialog box appears.<br />
4 If desired, click the Threshold text field, and type an initial threshold value to use for<br />
the analysis of the plate document.<br />
For more information about the threshold setting, see “Calculating Threshold<br />
Cycles” on page A-10.<br />
Note If no threshold is specified, the SDS software will automatically assign a<br />
threshold value during the analysis.<br />
5 If desired, set a default baseline for the analysis:<br />
a. Click the Baseline Start text field, and type or dial an initial baseline to use for the<br />
analysis of the plate document.<br />
b. Click the Stop text field, and type or dial an stop baseline to use for the analysis<br />
of the plate document.<br />
Note If no baseline is specified, the SDS software will use the default baseline<br />
range of cycles 3-15 for the analysis.<br />
6 Set the baseline and threshold values for any remaining detectors present on the<br />
plate as follows:<br />
a. From the Detector drop-down list, select another detector.<br />
b. Repeat steps 4 and 5 until the baseline and threshold values have been set for<br />
each detector.<br />
7 Click OK.<br />
The software closes the dialog box and configures the analysis with new settings.


