ABI Prism® 7900HT Sequence Detection System ... - OpenWetWare
ABI Prism® 7900HT Sequence Detection System ... - OpenWetWare
ABI Prism® 7900HT Sequence Detection System ... - OpenWetWare

You also want an ePaper? Increase the reach of your titles
YUMPU automatically turns print PDFs into web optimized ePapers that Google loves.
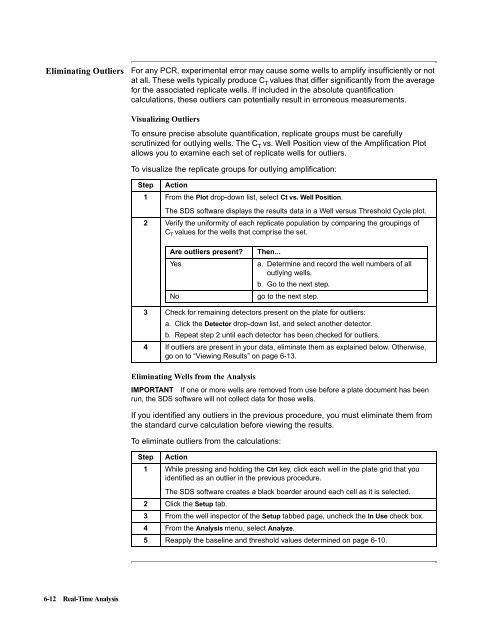
Eliminating Outliers For any PCR, experimental error may cause some wells to amplify insufficiently or not<br />
at all. These wells typically produce C T values that differ significantly from the average<br />
for the associated replicate wells. If included in the absolute quantification<br />
calculations, these outliers can potentially result in erroneous measurements.<br />
6-12 Real-Time Analysis<br />
Visualizing Outliers<br />
To ensure precise absolute quantification, replicate groups must be carefully<br />
scrutinized for outlying wells. The CT vs. Well Position view of the Amplification Plot<br />
allows you to examine each set of replicate wells for outliers.<br />
To visualize the replicate groups for outlying amplification:<br />
Step Action<br />
1 From the Plot drop-down list, select Ct vs. Well Position.<br />
The SDS software displays the results data in a Well versus Threshold Cycle plot.<br />
2 Verify the uniformity of each replicate population by comparing the groupings of<br />
CT values for the wells that comprise the set.<br />
Are outliers present? Then...<br />
Yes a. Determine and record the well numbers of all<br />
outlying wells.<br />
b. Go to the next step.<br />
No go to the next step.<br />
3 Check for remaining detectors present on the plate for outliers:<br />
a. Click the Detector drop-down list, and select another detector.<br />
b. Repeat step 2 until each detector has been checked for outliers.<br />
4 If outliers are present in your data, eliminate them as explained below. Otherwise,<br />
go on to “Viewing Results” on page 6-13.<br />
Eliminating Wells from the Analysis<br />
IMPORTANT If one or more wells are removed from use before a plate document has been<br />
run, the SDS software will not collect data for those wells.<br />
If you identified any outliers in the previous procedure, you must eliminate them from<br />
the standard curve calculation before viewing the results.<br />
To eliminate outliers from the calculations:<br />
Step Action<br />
1 While pressing and holding the Ctrl key, click each well in the plate grid that you<br />
identified as an outlier in the previous procedure.<br />
The SDS software creates a black boarder around each cell as it is selected.<br />
2 Click the Setup tab.<br />
3 From the well inspector of the Setup tabbed page, uncheck the In Use check box.<br />
4 From the Analysis menu, select Analyze.<br />
5 Reapply the baseline and threshold values determined on page 6-10.