

DHL Global Connectedness Index 2014
DHL Global Connectedness Index 2014
DHL Global Connectedness Index 2014
- No tags were found...

Create successful ePaper yourself
Turn your PDF publications into a flip-book with our unique Google optimized e-Paper software.
126 III. Country Profiles<br />
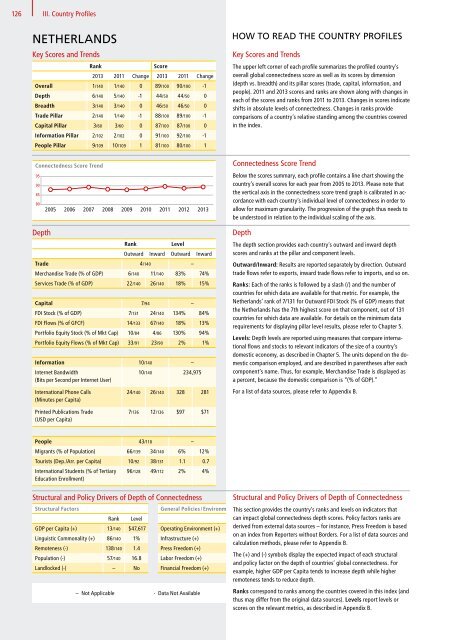
NETHERLANDS<br />
Key Scores and Trends<br />
Rank<br />
Score<br />
2013 2011 Change 2013 2011 Change<br />
Overall 1/140 1/140 0 89/100 90/100 -1<br />
Depth 6/140 5/140 -1 44/50 44/50 0<br />
Breadth 3/140 3/140 0 46/50 46/50 0<br />
Trade Pillar 2/140 1/140 -1 88/100 89/100 -1<br />
NLD<br />
Capital Pillar 3/60 3/60 0 87/100 87/100 0<br />
Information Pillar 2/102 2/102 0 91/100 92/100 -1<br />
People Pillar 9/109 10/109 1 81/100 80/100 1<br />
<strong>Connectedness</strong> Score Trend<br />
95<br />
90<br />
85<br />
80<br />
2005<br />
Depth<br />
2006<br />
2007<br />
2008<br />
2009<br />
Rank<br />
2010<br />
2011<br />
2012<br />
Level<br />
2013<br />
Outward Inward Outward Inward<br />
Trade 4/140 –<br />
Merchandise Trade (% of GDP) 6/140 11/140 83% 74%<br />
Services Trade (% of GDP) 22/140 26/140 18% 15%<br />
Capital 7/94 –<br />
FDI Stock (% of GDP) 7/131 24/140 134% 84%<br />
FDI Flows (% of GFCF) 14/133 67/140 18% 13%<br />
Portfolio Equity Stock (% of Mkt Cap) 10/84 4/86 130% 94%<br />
Portfolio Equity Flows (% of Mkt Cap) 33/91 23/90 2% 1%<br />
Information 10/140 –<br />
Internet Bandwidth<br />
10/140 234,975<br />
(Bits per Second per Internet User)<br />
International Phone Calls<br />
(Minutes per Capita)<br />
Printed Publications Trade<br />
(USD per Capita)<br />
24/140 26/140 328 281<br />
7/136 12/136 $97 $71<br />
People 43/118 –<br />
Migrants (% of Population) 66/139 34/140 6% 12%<br />
Tourists (Dep./Arr. per Capita) 10/92 38/131 1.1 0.7<br />
International Students (% of Tertiary<br />
Education Enrollment)<br />
96/128 49/112 2% 4%<br />
HOW TO READ THE COUNTRY PROFILES<br />
Rooted Key Scores Map and Trends<br />
The upper left corner of each profile summarizes the profiled country’s<br />
overall global connectedness score as well as its scores by dimension<br />
(depth vs. breadth) and its pillar scores (trade, capital, information, and<br />
people). 2011 and 2013 scores and ranks are shown along with changes in<br />
each of the scores and ranks from 2011 to 2013. Changes in scores indicate<br />
shifts in absolute levels of connectedness. Changes in ranks provide<br />
comparisons of a country’s relative standing among the countries covered<br />
in the index.<br />
<strong>Connectedness</strong> Score Trend<br />
Below the scores summary, each profile contains a line chart showing the<br />
country’s overall scores for each year from 2005 to 2013. Please note that<br />
the vertical axis in the connectedness score trend graph is calibrated in accordance<br />
with each country’s individual level of connectedness in order to<br />
allow for maximum granularity. The progression of the graph thus needs to<br />
be understood in relation to the individual scaling of the axis.<br />
Breadth Depth<br />
The depth section provides each country’s outward and inward depth<br />
scores and ranks at the pillar and component levels.<br />
Outward/Inward: Results are reported separately by direction. Outward<br />
trade flows refer to exports, inward trade flows refer to imports, and so on.<br />
Ranks: Each of the ranks is followed by a slash (/) and the number of<br />
countries for which data are available for that metric. For example, the<br />
Netherlands’ rank of 7/131 for Outward FDI Stock (% of GDP) means that<br />
the Netherlands has the 7th highest score on that component, out of 131<br />
countries for which data are available. For details on the minimum data<br />
requirements for displaying pillar level results, please refer to Chapter 5.<br />
Levels: Depth levels are reported using measures that compare international<br />
flows and stocks to relevant indicators of the size of a country’s<br />
domestic economy, as described in Chapter 5. The units depend on the domestic<br />
comparison employed, and are described in parentheses after each<br />
component’s name. Thus, for example, Merchandise Trade is displayed as<br />
a percent, because the domestic comparison is “(% of GDP).”<br />
For a list of data sources, please refer to Appendix B.<br />
Directionality<br />
Overall<br />
Depth<br />
Breadth<br />
-100 -80 -60 -40 -20 0 20 40 60 80 100<br />
Balance Inward Outward<br />
Structural and Policy Drivers of Depth of <strong>Connectedness</strong><br />
Structural Factors<br />
Rank<br />
Level<br />
GDP per Capita (+) 13/140 $47,617<br />
Linguistic Commonality (+) 86/140 1%<br />
Remoteness (-) 138/140 1.4<br />
Population (-) 57/140 16.8<br />
Landlocked (-) – No<br />
Structural and Policy Drivers of Depth of <strong>Connectedness</strong><br />
General Policies / EnvironmentThis section provides the country’s <strong>Global</strong>ization ranks and Policies levels on indicators that<br />
can impact Rank global Level connectedness depth scores. Policy factors Rank ranks Level are<br />
Operating Environment (+) derived from external data Enabling sources – Trade for instance, <strong>Index</strong> (+) Press Freedom is based <br />
on an index from Reporters without Borders. For a list of data sources and<br />
Infrastructure (+) Tariffs (Wtd. Mean Applied) (-) <br />
calculation methods, please refer to Appendix B.<br />
Press Freedom (+) Capital Account Openness (+) <br />
The (+) and (-) symbols display the expected impact of each structural<br />
Labor Freedom (+) Visa-Free Travel Outward (+) <br />
and policy factor on the depth of countries’ global connectedness. For<br />
Financial Freedom (+) Visa-Free Travel Inward (+) <br />
example, higher GDP per Capita tends to increase depth while higher<br />
remoteness tends to reduce depth.<br />
– Not Applicable · Data Not Available Ranks (+) Positive correspond Impact to ranks among the (-) countries Negative covered Impact in this index (and<br />
thus may differ from the original data sources). Levels report levels or<br />
scores on the relevant metrics, as described in Appendix B.


