

DHL Global Connectedness Index 2014
DHL Global Connectedness Index 2014
DHL Global Connectedness Index 2014
- No tags were found...

Create successful ePaper yourself
Turn your PDF publications into a flip-book with our unique Google optimized e-Paper software.
<strong>DHL</strong> <strong>Global</strong> <strong>Connectedness</strong> <strong>Index</strong> <strong>2014</strong><br />
49<br />
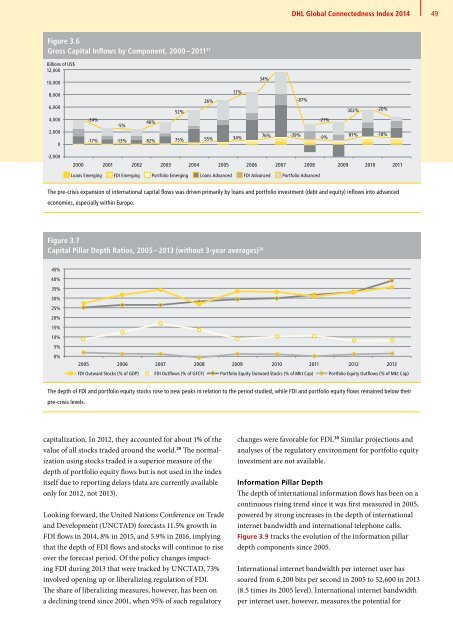
Figure 3.6<br />
Gross Capital Inflows by Component, 2000 – 2011 27<br />
Billions of US$<br />
12,000<br />
10,000<br />
34%<br />
8,000<br />
6,000<br />
4,000<br />
2,000<br />
0<br />
-34%<br />
-17%<br />
-5%<br />
-13%<br />
46%<br />
82%<br />
52%<br />
75%<br />
26%<br />
55%<br />
17%<br />
34%<br />
76%<br />
-39%<br />
-87%<br />
-21%<br />
-9%<br />
302%<br />
87%<br />
-20%<br />
-18%<br />
-2,000<br />
2000 2001 2002 2003 2004 2005 2006 2007 2008 2009 2010 2011<br />
Loans Emerging FDI Emerging Portfolio Emerging Loans Advanced FDI Advanced Portfolio Advanced<br />
The pre-crisis expansion of international capital flows was driven primarily by loans and portfolio investment (debt and equity) inflows into advanced<br />
economies, especially within Europe.<br />
Figure 3.7<br />
Capital Pillar Depth Ratios, 2005 – 2013 (without 3-year averages) 28<br />
45%<br />
40%<br />
35%<br />
30%<br />
25%<br />
20%<br />
15%<br />
10%<br />
5%<br />
0%<br />
2005 2006 2007 2008 2009 2010 2011 2012 2013<br />
FDI Outward Stocks (% of GDP) FDI Outflows (% of GFCF) Portfolio Equity Outward Stocks (% of Mkt Cap) Portfolio Equity Outflows (% of Mkt Cap)<br />
The depth of FDI and portfolio equity stocks rose to new peaks in relation to the period studied, while FDI and portfolio equity flows remained below their<br />
pre-crisis levels.<br />
capitalization. In 2012, they accounted for about 1% of the<br />
value of all stocks traded around the world. 29 The normalization<br />
using stocks traded is a superior measure of the<br />
depth of portfolio equity flows but is not used in the index<br />
itself due to reporting delays (data are currently available<br />
only for 2012, not 2013).<br />
Looking forward, the United Nations Conference on Trade<br />
and Development (UNCTAD) forecasts 11.5% growth in<br />
FDI flows in <strong>2014</strong>, 8% in 2015, and 5.9% in 2016, implying<br />
that the depth of FDI flows and stocks will continue to rise<br />
over the forecast period. Of the policy changes impacting<br />
FDI during 2013 that were tracked by UNCTAD, 73%<br />
involved opening up or liberalizing regulation of FDI.<br />
The share of liberalizing measures, however, has been on<br />
a declining trend since 2001, when 95% of such regulatory<br />
changes were favorable for FDI. 30 Similar projections and<br />
analyses of the regulatory environment for portfolio equity<br />
investment are not available.<br />
Information Pillar Depth<br />
The depth of international information flows has been on a<br />
continuous rising trend since it was first measured in 2005,<br />
powered by strong increases in the depth of international<br />
internet bandwidth and international telephone calls.<br />
Figure 3.9 tracks the evolution of the information pillar<br />
depth components since 2005. 31<br />
International internet bandwidth per internet user has<br />
soared from 6,200 bits per second in 2005 to 52,600 in 2013<br />
(8.5 times its 2005 level). International internet bandwidth<br />
per internet user, however, measures the potential for


