

DHL Global Connectedness Index 2014
DHL Global Connectedness Index 2014
DHL Global Connectedness Index 2014
- No tags were found...

Create successful ePaper yourself
Turn your PDF publications into a flip-book with our unique Google optimized e-Paper software.
<strong>DHL</strong> <strong>Global</strong> <strong>Connectedness</strong> <strong>Index</strong> <strong>2014</strong><br />
65<br />
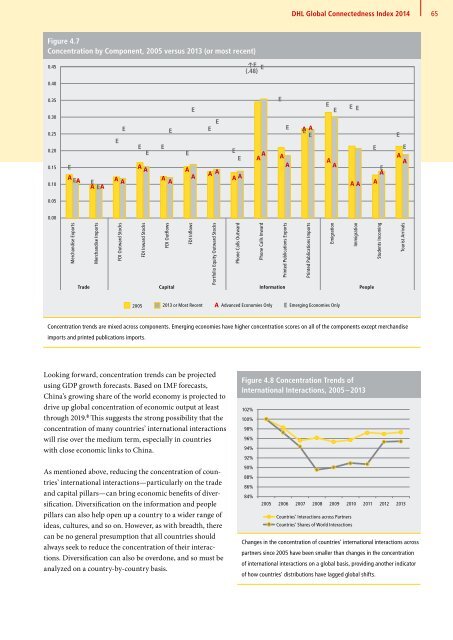
Figure 4.7<br />
Concentration by Component, 2005 versus 2013 (or most recent)<br />
0.45<br />
↑E<br />
(.48)<br />
E<br />
0.40<br />
0.35<br />
0.30<br />
0.25<br />
0.20<br />
0.15<br />
0.10<br />
A<br />
E<br />
E<br />
A A<br />
E<br />
E<br />
E A E<br />
A A<br />
E<br />
E<br />
A<br />
A<br />
E<br />
E<br />
A<br />
A<br />
E<br />
E<br />
A<br />
A<br />
E<br />
E<br />
A A<br />
E<br />
E<br />
E<br />
E A A A<br />
A A A<br />
A A<br />
A A<br />
AE A<br />
E<br />
E<br />
E<br />
E E<br />
E<br />
E<br />
A<br />
A<br />
E<br />
E<br />
A<br />
A<br />
0.05<br />
0.00<br />
Merchandise Exports<br />
Merchandise Imports<br />
FDI Outward Stocks<br />
FDI Inward Stocks<br />
FDI Outflows<br />
FDI Inflows<br />
Portfolio Equity Outward Stocks<br />
Phone Calls Outward<br />
Phone Calls Inward<br />
Printed Publications Exports<br />
Printed Publications Imports<br />
Emigration<br />
Immigration<br />
Students Incoming<br />
Trade Capital Information People<br />
Tourist Arrivals<br />
2005 2013 or Most Recent A Advanced Economies Only E Emerging Economies Only<br />
Concentration trends are mixed across components. Emerging economies have higher concentration scores on all of the components except merchandise<br />
imports and printed publications imports.<br />
Looking forward, concentration trends can be projected<br />
using GDP growth forecasts. Based on IMF forecasts,<br />
China’s growing share of the world economy is projected to<br />
drive up global concentration of economic output at least<br />
through 2019. 8 This suggests the strong possibility that the<br />
concentration of many countries’ international interactions<br />
will rise over the medium term, especially in countries<br />
with close economic links to China.<br />
As mentioned above, reducing the concentration of countries’<br />
international interactions—particularly on the trade<br />
and capital pillars—can bring economic benefits of diversification.<br />
Diversification on the information and people<br />
pillars can also help open up a country to a wider range of<br />
ideas, cultures, and so on. However, as with breadth, there<br />
can be no general presumption that all countries should<br />
always seek to reduce the concentration of their interactions.<br />
Diversification can also be overdone, and so must be<br />
analyzed on a country-by-country basis.<br />
Figure 4.8 Concentration Trends of<br />
International Interactions, 2005 – 2013<br />
102%<br />
100%<br />
98%<br />
96%<br />
94%<br />
92%<br />
90%<br />
88%<br />
86%<br />
84%<br />
2005 2006 2007 2008 2009 2010 2011 2012 2013<br />
Countries’ Interactions across Partners<br />
Countries’ Shares of World Interactions<br />
Changes in the concentration of countries’ international interactions across<br />
partners since 2005 have been smaller than changes in the concentration<br />
of international interactions on a global basis, providing another indicator<br />
of how countries’ distributions have lagged global shifts.


