

DHL Global Connectedness Index 2014
DHL Global Connectedness Index 2014
DHL Global Connectedness Index 2014
- No tags were found...

You also want an ePaper? Increase the reach of your titles
YUMPU automatically turns print PDFs into web optimized ePapers that Google loves.
210 III. Country Profiles<br />
MAURITIUS<br />
Key Scores and Trends<br />
Rank<br />
Score<br />
2013 2011 Change 2013 2011 Change<br />
Overall 46/140 44/140 -2 52/100 54/100 -2<br />
Depth 29/140 20/140 -9 32/50 34/50 -2<br />
Breadth 80/140 81/140 1 20/50 19/50 1<br />
Trade Pillar 33/140 41/140 8 61/100 59/100 2<br />
MUS<br />
Capital Pillar 50/60 43/60 -7 37/100 42/100 -5<br />
Information Pillar · · · · · ·<br />
People Pillar 48/109 49/109 1 58/100 57/100 1<br />
<strong>Connectedness</strong> Score Trend<br />
60<br />
55<br />
50<br />
45<br />
40<br />
35<br />
2005<br />
2006<br />
2007<br />
2008<br />
2009<br />
2010<br />
2011<br />
2012<br />
2013<br />
Rooted Map<br />
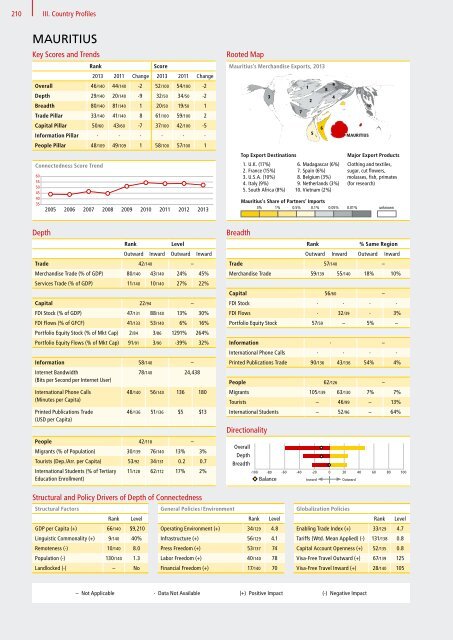
Rooted Map:<br />
Mauritius’s Mauritius’s Merchandise Merchandise Exports, Exports, 2013 2013<br />
3<br />
Top Export Destinations<br />
1. U.K. (17%)<br />
2. France (15%)<br />
3. U.S.A. (10%)<br />
4. Italy (9%)<br />
5. South Africa (8%)<br />
7<br />
1<br />
2<br />
5<br />
6. Madagascar (6%)<br />
7. Spain (6%)<br />
8. Belgium (3%)<br />
9. Netherlands (3%)<br />
10. Vietnam (2%)<br />
MAURITIUS<br />
Mauritius’s Share of Partners’ Imports<br />
3% 1% 0.5% 0.1% 0.05% 0.01% unknown<br />
6<br />
8<br />
9<br />
4<br />
10<br />
Major Export Products<br />
Clothing and textiles,<br />
sugar, cut flowers,<br />
molasses, fish, primates<br />
(for research)<br />
Depth<br />
Rank<br />
Level<br />
Outward Inward Outward Inward<br />
Trade 42/140 –<br />
Merchandise Trade (% of GDP) 80/140 43/140 24% 45%<br />
Services Trade (% of GDP) 11/140 10/140 27% 22%<br />
Capital 22/94 –<br />
FDI Stock (% of GDP) 47/131 88/140 13% 30%<br />
FDI Flows (% of GFCF) 41/133 53/140 6% 16%<br />
Portfolio Equity Stock (% of Mkt Cap) 2/84 3/86 1291% 264%<br />
Portfolio Equity Flows (% of Mkt Cap) 91/91 3/90 -39% 32%<br />
Information 58/140 –<br />
Internet Bandwidth<br />
78/140 24,438<br />
(Bits per Second per Internet User)<br />
International Phone Calls<br />
(Minutes per Capita)<br />
Printed Publications Trade<br />
(USD per Capita)<br />
48/140 56/140 136 180<br />
46/136 51/136 $5 $13<br />
People 42/118 –<br />
Migrants (% of Population) 30/139 76/140 13% 3%<br />
Tourists (Dep./Arr. per Capita) 53/92 34/131 0.2 0.7<br />
International Students (% of Tertiary<br />
Education Enrollment)<br />
11/128 62/112 17% 2%<br />
Breadth<br />
Rank<br />
% Same Region<br />
Outward Inward Outward Inward<br />
Trade 57/140 –<br />
Merchandise Trade 59/139 55/140 18% 10%<br />
Capital 56/60 –<br />
MUS<br />
FDI Stock · · · ·<br />
FDI Flows · 32/39 · 3%<br />
Portfolio Equity Stock 57/59 – 5% –<br />
Information · –<br />
60<br />
International 55 Phone Calls · · · ·<br />
50<br />
Printed Publications Trade<br />
45<br />
90/136 43/136 54% 4%<br />
40<br />
35<br />
People 2005 2006 2007 200862/126 2009 2010 2011 – 2012<br />
Migrants 105/139 63/130 7% 7%<br />
Tourists – 46/99 – 13%<br />
International Students – 52/96 – 64%<br />
Directionality<br />
Overall<br />
Depth<br />
Breadth<br />
-100 -80 -60 -40 -20 0 20 40 60 80 100<br />
Balance Inward Outward<br />
2013<br />
Structural and Policy Drivers of Depth of <strong>Connectedness</strong><br />
Structural Factors<br />
Rank<br />
Level<br />
GDP per Capita (+) 66/140 $9,210 <br />
Linguistic Commonality (+) 9/140 40% <br />
Remoteness (-) 10/140 8.0 <br />
Population (-) 130/140 1.3 <br />
Landlocked (-) – No <br />
General Policies / Environment<br />
Rank<br />
Level<br />
Operating Environment (+) 34/129 4.8 <br />
Infrastructure (+) 56/129 4.1 <br />
Press Freedom (+) 53/137 74 <br />
Labor Freedom (+) 40/140 78 <br />
Financial Freedom (+) 17/140 70 <br />
<strong>Global</strong>ization Policies<br />
Rank<br />
Level<br />
Enabling Trade <strong>Index</strong> (+) 33/129 4.7 <br />
Tariffs (Wtd. Mean Applied) (-) 131/138 0.8 <br />
Capital Account Openness (+) 52/135 0.8 <br />
Visa-Free Travel Outward (+) 67/139 125 <br />
Visa-Free Travel Inward (+) 28/140 105 <br />
– Not Applicable · Data Not Available (+) Positive Impact (-) Negative Impact


