

DHL Global Connectedness Index 2014
DHL Global Connectedness Index 2014
DHL Global Connectedness Index 2014
- No tags were found...

You also want an ePaper? Increase the reach of your titles
YUMPU automatically turns print PDFs into web optimized ePapers that Google loves.
<strong>DHL</strong> <strong>Global</strong> <strong>Connectedness</strong> <strong>Index</strong> <strong>2014</strong><br />
45<br />
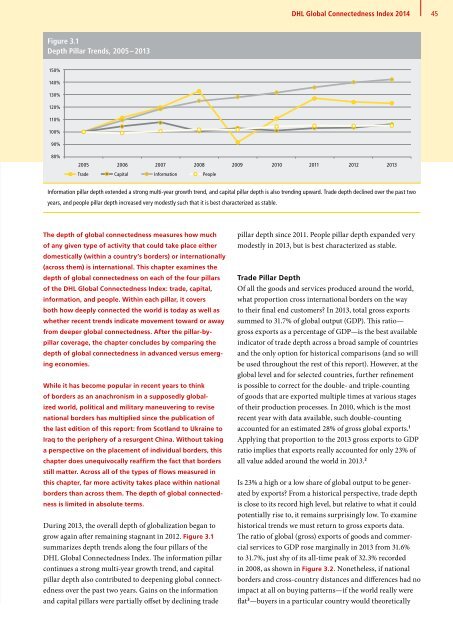
Figure 3.1<br />
Depth Pillar Trends, 2005 – 2013<br />
150%<br />
140%<br />
130%<br />
120%<br />
110%<br />
100%<br />
90%<br />
80%<br />
2005 2006 2007 2008 2009 2010 2011 2012 2013<br />
Trade Capital Information People<br />
Information pillar depth extended a strong multi-year growth trend, and capital pillar depth is also trending upward. Trade depth declined over the past two<br />
years, and people pillar depth increased very modestly such that it is best characterized as stable.<br />
The depth of global connectedness measures how much<br />
of any given type of activity that could take place either<br />
domestically (within a country’s borders) or internationally<br />
(across them) is international. This chapter examines the<br />
depth of global connectedness on each of the four pillars<br />
of the <strong>DHL</strong> <strong>Global</strong> <strong>Connectedness</strong> <strong>Index</strong>: trade, capital,<br />
information, and people. Within each pillar, it covers<br />
both how deeply connected the world is today as well as<br />
whether recent trends indicate movement toward or away<br />
from deeper global connectedness. After the pillar-bypillar<br />
coverage, the chapter concludes by comparing the<br />
depth of global connectedness in advanced versus emerging<br />
economies.<br />
While it has become popular in recent years to think<br />
of borders as an anachronism in a supposedly globalized<br />
world, political and military maneuvering to revise<br />
national borders has multiplied since the publication of<br />
the last edition of this report: from Scotland to Ukraine to<br />
Iraq to the periphery of a resurgent China. Without taking<br />
a perspective on the placement of individual borders, this<br />
chapter does unequivocally reaffirm the fact that borders<br />
still matter. Across all of the types of flows measured in<br />
this chapter, far more activity takes place within national<br />
borders than across them. The depth of global connectedness<br />
is limited in absolute terms.<br />
During 2013, the overall depth of globalization began to<br />
grow again after remaining stagnant in 2012. Figure 3.1<br />
summarizes depth trends along the four pillars of the<br />
<strong>DHL</strong> <strong>Global</strong> <strong>Connectedness</strong> <strong>Index</strong>. The information pillar<br />
continues a strong multi-year growth trend, and capital<br />
pillar depth also contributed to deepening global connectedness<br />
over the past two years. Gains on the information<br />
and capital pillars were partially offset by declining trade<br />
pillar depth since 2011. People pillar depth expanded very<br />
modestly in 2013, but is best characterized as stable.<br />
Trade Pillar Depth<br />
Of all the goods and services produced around the world,<br />
what proportion cross international borders on the way<br />
to their final end customers In 2013, total gross exports<br />
summed to 31.7% of global output (GDP). This ratio—<br />
gross exports as a percentage of GDP—is the best available<br />
indicator of trade depth across a broad sample of countries<br />
and the only option for historical comparisons (and so will<br />
be used throughout the rest of this report). However, at the<br />
global level and for selected countries, further refinement<br />
is possible to correct for the double- and triple-counting<br />
of goods that are exported multiple times at various stages<br />
of their production processes. In 2010, which is the most<br />
recent year with data available, such double-counting<br />
accounted for an estimated 28% of gross global exports. 1<br />
Applying that proportion to the 2013 gross exports to GDP<br />
ratio implies that exports really accounted for only 23% of<br />
all value added around the world in 2013. 2<br />
Is 23% a high or a low share of global output to be generated<br />
by exports From a historical perspective, trade depth<br />
is close to its record high level, but relative to what it could<br />
potentially rise to, it remains surprisingly low. To examine<br />
historical trends we must return to gross exports data.<br />
The ratio of global (gross) exports of goods and commercial<br />
services to GDP rose marginally in 2013 from 31.6%<br />
to 31.7%, just shy of its all-time peak of 32.3% recorded<br />
in 2008, as shown in Figure 3.2. Nonetheless, if national<br />
borders and cross-country distances and differences had no<br />
impact at all on buying patterns—if the world really were<br />
flat 3 —buyers in a particular country would theoretically


