

DHL Global Connectedness Index 2014
DHL Global Connectedness Index 2014
DHL Global Connectedness Index 2014
- No tags were found...

You also want an ePaper? Increase the reach of your titles
YUMPU automatically turns print PDFs into web optimized ePapers that Google loves.
82 5. <strong>DHL</strong> <strong>Global</strong> <strong>Connectedness</strong> <strong>Index</strong> Methodology<br />
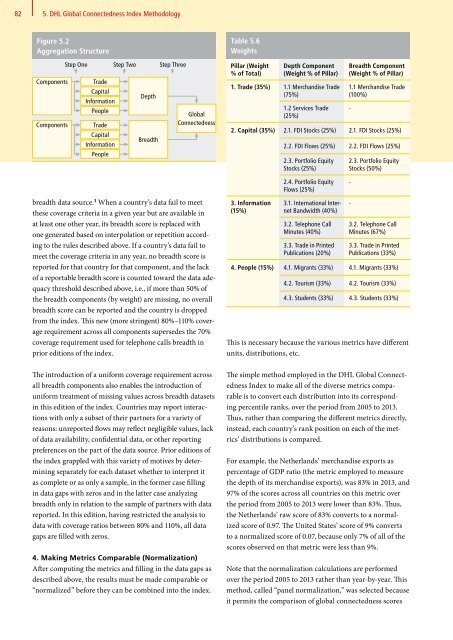
Figure 5.2<br />
Aggregation Structure<br />
Components<br />
Components<br />
Step One Step Two Step Three<br />
Trade<br />
Capital<br />
Information<br />
People<br />
Trade<br />
Capital<br />
Information<br />
People<br />
Depth<br />
Breadth<br />
<strong>Global</strong><br />
<strong>Connectedness</strong><br />
Table 5.6<br />
Weights<br />
Pillar (Weight<br />
% of Total)<br />
Depth Component<br />
(Weight % of Pillar)<br />
1. Trade (35%) 1.1 Merchandise Trade<br />
(75%)<br />
1.2 Services Trade<br />
(25%)<br />
Breadth Component<br />
(Weight % of Pillar)<br />
1.1 Merchandise Trade<br />
(100%)<br />
2. Capital (35%) 2.1. FDI Stocks (25%) 2.1. FDI Stocks (25%)<br />
2.2. FDI Flows (25%) 2.2. FDI Flows (25%)<br />
2.3. Portfolio Equity<br />
Stocks (25%)<br />
-<br />
2.3. Portfolio Equity<br />
Stocks (50%)<br />
2.4. Portfolio Equity<br />
Flows (25%)<br />
-<br />
breadth data source. 3 When a country’s data fail to meet<br />
these coverage criteria in a given year but are available in<br />
at least one other year, its breadth score is replaced with<br />
one generated based on interpolation or repetition according<br />
to the rules described above. If a country’s data fail to<br />
meet the coverage criteria in any year, no breadth score is<br />
reported for that country for that component, and the lack<br />
of a reportable breadth score is counted toward the data adequacy<br />
threshold described above, i.e., if more than 50% of<br />
the breadth components (by weight) are missing, no overall<br />
breadth score can be reported and the country is dropped<br />
from the index. This new (more stringent) 80%–110% coverage<br />
requirement across all components supersedes the 70%<br />
coverage requirement used for telephone calls breadth in<br />
prior editions of the index.<br />
3. Information<br />
(15%)<br />
3.1. International Internet<br />
Bandwidth (40%)<br />
3.2. Telephone Call<br />
Minutes (40%)<br />
3.3. Trade in Printed<br />
Publications (20%)<br />
This is necessary because the various metrics have different<br />
units, distributions, etc.<br />
-<br />
3.2. Telephone Call<br />
Minutes (67%)<br />
3.3. Trade in Printed<br />
Publications (33%)<br />
4. People (15%) 4.1. Migrants (33%) 4.1. Migrants (33%)<br />
4.2. Tourism (33%) 4.2. Tourism (33%)<br />
4.3. Students (33%) 4.3. Students (33%)<br />
The introduction of a uniform coverage requirement across<br />
all breadth components also enables the introduction of<br />
uniform treatment of missing values across breadth datasets<br />
in this edition of the index. Countries may report interactions<br />
with only a subset of their partners for a variety of<br />
reasons: unreported flows may reflect negligible values, lack<br />
of data availability, confidential data, or other reporting<br />
preferences on the part of the data source. Prior editions of<br />
the index grappled with this variety of motives by determining<br />
separately for each dataset whether to interpret it<br />
as complete or as only a sample, in the former case filling<br />
in data gaps with zeros and in the latter case analyzing<br />
breadth only in relation to the sample of partners with data<br />
reported. In this edition, having restricted the analysis to<br />
data with coverage ratios between 80% and 110%, all data<br />
gaps are filled with zeros.<br />
4. Making Metrics Comparable (Normalization)<br />
After computing the metrics and filling in the data gaps as<br />
described above, the results must be made comparable or<br />
“normalized” before they can be combined into the index.<br />
The simple method employed in the <strong>DHL</strong> <strong>Global</strong> <strong>Connectedness</strong><br />
<strong>Index</strong> to make all of the diverse metrics comparable<br />
is to convert each distribution into its corresponding<br />
percentile ranks, over the period from 2005 to 2013.<br />
Thus, rather than comparing the different metrics directly,<br />
instead, each country’s rank position on each of the metrics’<br />
distributions is compared.<br />
For example, the Netherlands’ merchandise exports as<br />
percentage of GDP ratio (the metric employed to measure<br />
the depth of its merchandise exports), was 83% in 2013, and<br />
97% of the scores across all countries on this metric over<br />
the period from 2005 to 2013 were lower than 83%. Thus,<br />
the Netherlands’ raw score of 83% converts to a normalized<br />
score of 0.97. The United States’ score of 9% converts<br />
to a normalized score of 0.07, because only 7% of all of the<br />
scores observed on that metric were less than 9%.<br />
Note that the normalization calculations are performed<br />
over the period 2005 to 2013 rather than year-by-year. This<br />
method, called “panel normalization,” was selected because<br />
it permits the comparison of global connectedness scores


