

DHL Global Connectedness Index 2014
DHL Global Connectedness Index 2014
DHL Global Connectedness Index 2014
- No tags were found...

Create successful ePaper yourself
Turn your PDF publications into a flip-book with our unique Google optimized e-Paper software.
176 III. Country Profiles<br />
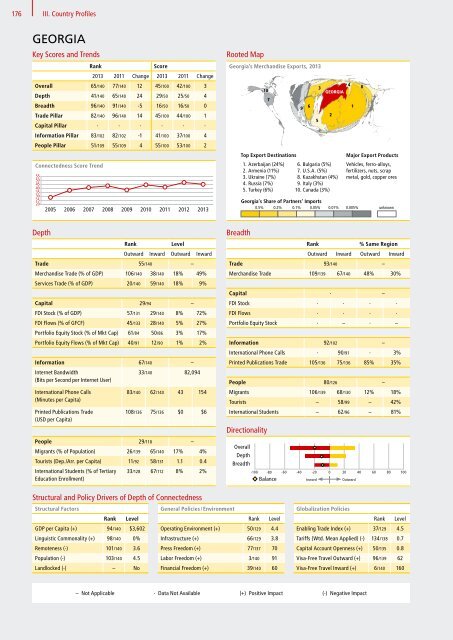
GEORGIA<br />
Key Scores and Trends<br />
Rank<br />
Score<br />
2013 2011 Change 2013 2011 Change<br />
Overall 65/140 77/140 12 45/100 42/100 3<br />
Depth 41/140 65/140 24 29/50 25/50 4<br />
Breadth 96/140 91/140 -5 16/50 16/50 0<br />
Trade Pillar 82/140 96/140 14 45/100 44/100 1<br />
GEO<br />
Capital Pillar · · · · · ·<br />
Information Pillar 83/102 82/102 -1 41/100 37/100 4<br />
People Pillar 51/109 55/109 4 55/100 53/100 2<br />
<strong>Connectedness</strong> Score Trend<br />
55<br />
50<br />
45<br />
40<br />
35<br />
30<br />
25<br />
20<br />
2005<br />
2006<br />
2007<br />
2008<br />
2009<br />
2010<br />
2011<br />
2012<br />
2013<br />
Rooted Map<br />
Rooted Map:<br />
Georgia’s Georgia’s Merchandise Merchandise Exports, Exports, 2013 2013<br />
10<br />
7<br />
Top Export Destinations<br />
1. Azerbaijan (24%)<br />
2. Armenia (11%)<br />
3. Ukraine (7%)<br />
4. Russia (7%)<br />
5. Turkey (6%)<br />
9<br />
6<br />
5<br />
GEORGIA<br />
Georgia’s Share of Partners’ Imports<br />
0.5% 0.2% 0.1% 0.05% 0.01% 0.005% unknown<br />
3<br />
2<br />
6. Bulgaria (5%)<br />
7. U.S.A. (5%)<br />
8. Kazakhstan (4%)<br />
9. Italy (3%)<br />
10. Canada (3%)<br />
4<br />
1<br />
8<br />
Major Export Products<br />
Vehicles, ferro-alloys,<br />
fertilizers, nuts, scrap<br />
metal, gold, copper ores<br />
Depth<br />
Rank<br />
Level<br />
Outward Inward Outward Inward<br />
Trade 55/140 –<br />
Merchandise Trade (% of GDP) 106/140 38/140 18% 49%<br />
Services Trade (% of GDP) 20/140 59/140 18% 9%<br />
Capital 29/94 –<br />
FDI Stock (% of GDP) 57/131 29/140 8% 72%<br />
FDI Flows (% of GFCF) 45/133 28/140 5% 27%<br />
Portfolio Equity Stock (% of Mkt Cap) 61/84 50/86 3% 17%<br />
Portfolio Equity Flows (% of Mkt Cap) 40/91 12/90 1% 2%<br />
Information 67/140 –<br />
Internet Bandwidth<br />
33/140 82,094<br />
(Bits per Second per Internet User)<br />
International Phone Calls<br />
(Minutes per Capita)<br />
Printed Publications Trade<br />
(USD per Capita)<br />
83/140 62/140 43 154<br />
108/136 75/136 $0 $6<br />
People 29/118 –<br />
Migrants (% of Population) 26/139 65/140 17% 4%<br />
Tourists (Dep./Arr. per Capita) 11/92 58/131 1.1 0.4<br />
International Students (% of Tertiary<br />
Education Enrollment)<br />
33/128 67/112 8% 2%<br />
Breadth<br />
Rank<br />
% Same Region<br />
Outward Inward Outward Inward<br />
Trade 93/140 –<br />
Merchandise Trade 109/139 67/140 48% 30%<br />
Capital · –<br />
GEO<br />
FDI Stock · · · ·<br />
FDI Flows · · · ·<br />
Portfolio Equity Stock · – · –<br />
Information 92/102 –<br />
55<br />
International 50 Phone Calls · 90/91 · 3%<br />
45<br />
Printed 40<br />
35 Publications Trade 105/136 75/136 85% 35%<br />
30<br />
25<br />
20<br />
People 2005 2006 2007 200880/126 2009 2010 2011 – 2012<br />
Migrants 106/139 68/130 12% 18%<br />
Tourists – 58/99 – 42%<br />
International Students – 62/96 – 81%<br />
Directionality<br />
Overall<br />
Depth<br />
Breadth<br />
-100 -80 -60 -40 -20 0 20 40 60 80 100<br />
Balance Inward Outward<br />
2013<br />
Structural and Policy Drivers of Depth of <strong>Connectedness</strong><br />
Structural Factors<br />
Rank<br />
Level<br />
GDP per Capita (+) 94/140 $3,602 <br />
Linguistic Commonality (+) 98/140 0% <br />
Remoteness (-) 101/140 3.6 <br />
Population (-) 103/140 4.5 <br />
Landlocked (-) – No <br />
General Policies / Environment<br />
Rank<br />
Level<br />
Operating Environment (+) 50/129 4.4 <br />
Infrastructure (+) 66/129 3.8 <br />
Press Freedom (+) 77/137 70 <br />
Labor Freedom (+) 3/140 91 <br />
Financial Freedom (+) 39/140 60 <br />
<strong>Global</strong>ization Policies<br />
Rank<br />
Level<br />
Enabling Trade <strong>Index</strong> (+) 37/129 4.5 <br />
Tariffs (Wtd. Mean Applied) (-) 134/138 0.7 <br />
Capital Account Openness (+) 50/135 0.8 <br />
Visa-Free Travel Outward (+) 96/139 62 <br />
Visa-Free Travel Inward (+) 6/140 160 <br />
– Not Applicable · Data Not Available (+) Positive Impact (-) Negative Impact


