

DHL Global Connectedness Index 2014
DHL Global Connectedness Index 2014
DHL Global Connectedness Index 2014
- No tags were found...

Create successful ePaper yourself
Turn your PDF publications into a flip-book with our unique Google optimized e-Paper software.
<strong>DHL</strong> <strong>Global</strong> <strong>Connectedness</strong> <strong>Index</strong> <strong>2014</strong><br />
61<br />
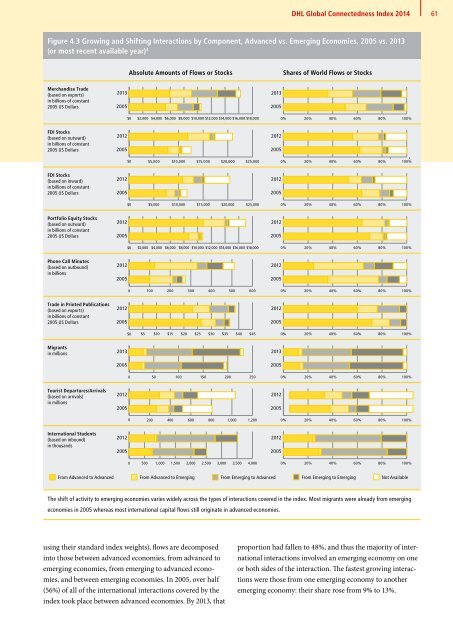
Figure 4.3 Growing and Shifting Interactions by Component, Advanced vs. Emerging Economies, 2005 vs. 2013<br />
(or most recent available year) 4<br />
Absolute Amounts of Flows or Stocks<br />
Shares of World Flows or Stocks<br />
Merchandise Trade<br />
(based on exports)<br />
in billions of constant<br />
2005 US Dollars<br />
Merchandise<br />
2013<br />
2005<br />
2013<br />
2005<br />
Merch<br />
$0 $2,000 $4,000 $6,000 $8,000 $10,000 $12,000 $14,000 $16,000 $18,000<br />
0% 20% 40% 60% 80% 100%<br />
FDI Stocks<br />
(based on outward)<br />
in billions of constant<br />
2005 US Dollars<br />
FDI outward<br />
2012<br />
2005<br />
2012<br />
2005<br />
FDI ou<br />
$0 $5,000 $10,000 $15,000 $20,000 $25,000<br />
0% 20% 40% 60% 80% 100%<br />
FDI Stocks<br />
(based on inward)<br />
in billions of constant<br />
2005 FDI US Inward Dollars<br />
2012<br />
2005<br />
2012<br />
2005<br />
FDI Inw<br />
$0 $5,000 $10,000 $15,000 $20,000 $25,000<br />
0% 20% 40% 60% 80% 100%<br />
Portfolio Equity Stocks<br />
(based on outward)<br />
in billions of constant<br />
2005<br />
Portfolio<br />
US Dollars<br />
2012<br />
2005<br />
2012<br />
2005<br />
Portfo<br />
$0 $2,000 $4,000 $6,000 $8,000 $10,000 $12,000 $14,000 $16,000 $18,000<br />
0% 20% 40% 60% 80% 100%<br />
Phone Call Minutes<br />
(based on outbound)<br />
in billions<br />
Phone<br />
2012<br />
2005<br />
2012<br />
2005<br />
Phone<br />
0 100 200 300 400 500 600<br />
0% 20% 40% 60% 80% 100%<br />
Trade in Printed Publications<br />
(based on exports)<br />
billions of constant<br />
2005<br />
Print<br />
US Dollars<br />
2012<br />
2005<br />
2012<br />
2005<br />
Print<br />
$0 $5 $10 $15 $20 $25 $30 $35 $40 $45<br />
0% 20% 40% 60% 80% 100%<br />
Migrants<br />
in millions<br />
Migration<br />
2013<br />
2005<br />
2013<br />
2005<br />
Migrat<br />
0 50 100 150 200 250<br />
0% 20% 40% 60% 80% 100%<br />
Tourist Departures/Arrivals<br />
(based on arrivals)<br />
in millions<br />
Tourist<br />
2012<br />
2005<br />
2012<br />
2005<br />
Tourist<br />
0 200 400 600 800 1,000 1,200<br />
0% 20% 40% 60% 80% 100%<br />
International Students<br />
(based on inbound)<br />
in thousands<br />
Students<br />
2012<br />
2005<br />
2012<br />
2005<br />
Studen<br />
0 500 1,000 1,500 2,000 2,500 3,000 3,500 4,000<br />
0% 20% 40% 60% 80% 100%<br />
From Advanced to Advanced From Advanced to Emerging From Emerging to Advanced From Emerging to Emerging Not Available<br />
Advanced Advanced<br />
Advanced Emerging<br />
The shift of activity to emerging economies varies widely across the types Emerging of interactions Advanced covered in Emerging the index. Emerging Most migrants were already from emerging<br />
economies in 2005 whereas most international capital flows still originate in advanced economies.<br />
using their standard index weights), flows are decomposed<br />
into those between advanced economies, from advanced to<br />
emerging economies, from emerging to advanced economies,<br />
and between emerging economies. In 2005, over half<br />
(56%) of all of the international interactions covered by the<br />
index took place between advanced economies. By 2013, that<br />
proportion had fallen to 48%, and thus the majority of international<br />
interactions involved an emerging economy on one<br />
or both sides of the interaction. The fastest growing interactions<br />
were those from one emerging economy to another<br />
emerging economy: their share rose from 9% to 13%. 3


