

DHL Global Connectedness Index 2014
DHL Global Connectedness Index 2014
DHL Global Connectedness Index 2014
- No tags were found...

You also want an ePaper? Increase the reach of your titles
YUMPU automatically turns print PDFs into web optimized ePapers that Google loves.
66 4. The Breadth of <strong>Global</strong> <strong>Connectedness</strong><br />
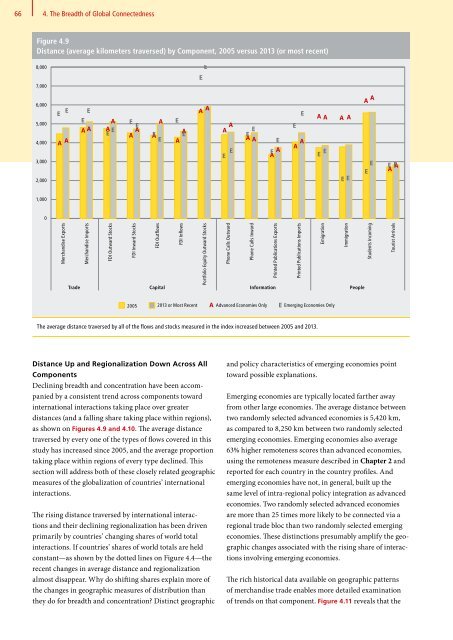
Figure 4.9<br />
Distance (average kilometers traversed) by Component, 2005 versus 2013 (or most recent)<br />
8,000<br />
E<br />
E<br />
7,000<br />
6,000<br />
5,000<br />
4,000<br />
3,000<br />
2,000<br />
E E<br />
A<br />
A<br />
E<br />
E<br />
A A<br />
A E A E<br />
E<br />
A<br />
E E A A<br />
AE E A<br />
A<br />
E<br />
A A E<br />
E<br />
A A<br />
A A E E<br />
E<br />
A A A A<br />
E<br />
E<br />
A A A A<br />
E<br />
E E<br />
E E<br />
A A<br />
E<br />
E<br />
E E<br />
A A<br />
1,000<br />
0<br />
Merchandise Exports<br />
Merchandise Imports<br />
FDI Outward Stocks<br />
FDI Inward Stocks<br />
FDI Outflows<br />
FDI Inflows<br />
Portfolio Equity Outward Stocks<br />
Phone Calls Outward<br />
Phone Calls Inward<br />
Printed Publications Exports<br />
Printed Publications Imports<br />
Emigration<br />
Immigration<br />
Students Incoming<br />
Trade Capital Information People<br />
Tourist Arrivals<br />
2005 2013 or Most Recent A Advanced Economies Only E Emerging Economies Only<br />
The average distance traversed by all of the flows and stocks measured in the index increased between 2005 and 2013.<br />
Distance Up and Regionalization Down Across All<br />
Components<br />
Declining breadth and concentration have been accompanied<br />
by a consistent trend across components toward<br />
international interactions taking place over greater<br />
distances (and a falling share taking place within regions),<br />
as shown on Figures 4.9 and 4.10. The average distance<br />
traversed by every one of the types of flows covered in this<br />
study has increased since 2005, and the average proportion<br />
taking place within regions of every type declined. This<br />
section will address both of these closely related geographic<br />
measures of the globalization of countries’ international<br />
interactions.<br />
The rising distance traversed by international interactions<br />
and their declining regionalization has been driven<br />
primarily by countries’ changing shares of world total<br />
interactions. If countries’ shares of world totals are held<br />
constant—as shown by the dotted lines on Figure 4.4—the<br />
recent changes in average distance and regionalization<br />
almost disappear. Why do shifting shares explain more of<br />
the changes in geographic measures of distribution than<br />
they do for breadth and concentration Distinct geographic<br />
and policy characteristics of emerging economies point<br />
toward possible explanations.<br />
Emerging economies are typically located farther away<br />
from other large economies. The average distance between<br />
two randomly selected advanced economies is 5,420 km,<br />
as compared to 8,250 km between two randomly selected<br />
emerging economies. Emerging economies also average<br />
63% higher remoteness scores than advanced economies,<br />
using the remoteness measure described in Chapter 2 and<br />
reported for each country in the country profiles. And<br />
emerging economies have not, in general, built up the<br />
same level of intra-regional policy integration as advanced<br />
economies. Two randomly selected advanced economies<br />
are more than 25 times more likely to be connected via a<br />
regional trade bloc than two randomly selected emerging<br />
economies. These distinctions presumably amplify the geographic<br />
changes associated with the rising share of interactions<br />
involving emerging economies.<br />
The rich historical data available on geographic patterns<br />
of merchandise trade enables more detailed examination<br />
of trends on that component. Figure 4.11 reveals that the


