

DHL Global Connectedness Index 2014
DHL Global Connectedness Index 2014
DHL Global Connectedness Index 2014
- No tags were found...

Create successful ePaper yourself
Turn your PDF publications into a flip-book with our unique Google optimized e-Paper software.
<strong>DHL</strong> <strong>Global</strong> <strong>Connectedness</strong> <strong>Index</strong> <strong>2014</strong><br />
223<br />
NIGERIA<br />
Key Scores and Trends<br />
Rank<br />
Score<br />
2013 2011 Change 2013 2011 Change<br />
Overall 38/140 42/140 4 56/100 55/100 1<br />
Depth 98/140 94/140 -4 17/50 18/50 -1<br />
Breadth 12/140 20/140 8 39/50 36/50 3<br />
Trade Pillar 48/140 44/140 -4 57/100 59/100 -2<br />
NGA<br />
Capital Pillar · · · · · ·<br />
Information Pillar 72/102 70/102 -2 46/100 45/100 1<br />
People Pillar · · · · · ·<br />
<strong>Connectedness</strong> Score Trend<br />
65<br />
60<br />
55<br />
50<br />
45<br />
40<br />
2005<br />
2006<br />
2007<br />
2008<br />
2009<br />
2010<br />
2011<br />
2012<br />
2013<br />
Rooted Map<br />
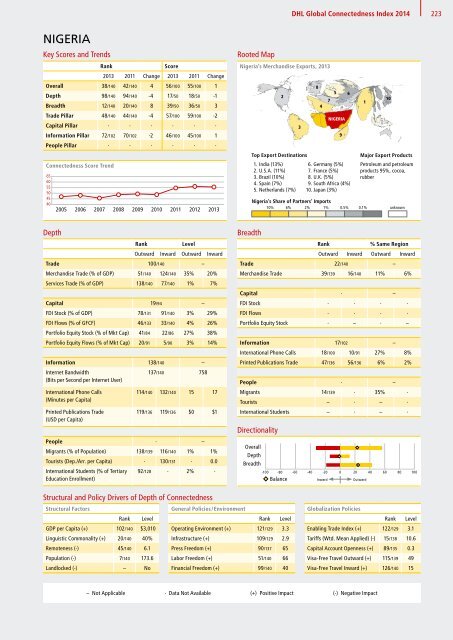
Rooted Map:<br />
Nigeria’s Nigeria’s Merchandise Merchandise Exports, Exports, 2013 2013<br />
Top Export Destinations<br />
2<br />
1. India (13%)<br />
2. U.S.A. (11%)<br />
3. Brazil (10%)<br />
4. Spain (7%)<br />
5. Netherlands (7%)<br />
3<br />
8<br />
4<br />
7<br />
NIGERIA<br />
6. Germany (5%)<br />
7. France (5%)<br />
8. U.K. (5%)<br />
9. South Africa (4%)<br />
10. Japan (3%)<br />
Nigeria’s Share of Partners’ Imports<br />
10% 6% 2% 1% 0.5% 0.1% unknown<br />
5<br />
9<br />
6<br />
1<br />
10<br />
Major Export Products<br />
Petroleum and petroleum<br />
products 95%, cocoa,<br />
rubber<br />
Depth<br />
Rank<br />
Level<br />
Outward Inward Outward Inward<br />
Trade 100/140 –<br />
Merchandise Trade (% of GDP) 51/140 124/140 35% 20%<br />
Services Trade (% of GDP) 138/140 77/140 1% 7%<br />
Capital 19/94 –<br />
FDI Stock (% of GDP) 78/131 91/140 3% 29%<br />
FDI Flows (% of GFCF) 46/133 33/140 4% 26%<br />
Portfolio Equity Stock (% of Mkt Cap) 41/84 22/86 27% 38%<br />
Portfolio Equity Flows (% of Mkt Cap) 20/91 5/90 3% 14%<br />
Information 138/140 –<br />
Internet Bandwidth<br />
137/140 758<br />
(Bits per Second per Internet User)<br />
International Phone Calls<br />
(Minutes per Capita)<br />
Printed Publications Trade<br />
(USD per Capita)<br />
114/140 132/140 15 17<br />
119/136 119/136 $0 $1<br />
People · –<br />
Migrants (% of Population) 138/139 116/140 1% 1%<br />
Tourists (Dep./Arr. per Capita) · 130/131 · 0.0<br />
International Students (% of Tertiary<br />
Education Enrollment)<br />
92/128 · 2% ·<br />
Breadth<br />
Rank<br />
% Same Region<br />
Outward Inward Outward Inward<br />
Trade 22/140 –<br />
Merchandise Trade 39/139 16/140 11% 6%<br />
Capital · –<br />
NGA<br />
FDI Stock · · · ·<br />
FDI Flows · · · ·<br />
Portfolio Equity Stock · – · –<br />
Information 17/102 –<br />
65<br />
International 60 Phone Calls 18/100 10/91 27% 8%<br />
55<br />
Printed Publications Trade<br />
50<br />
47/136 56/136 6% 2%<br />
45<br />
40<br />
People 2005 2006 2007 2008 · 2009 2010 2011 – 2012<br />
Migrants 14/139 · 35% ·<br />
Tourists – · – ·<br />
International Students – · – ·<br />
Directionality<br />
Overall<br />
Depth<br />
Breadth<br />
-100 -80 -60 -40 -20 0 20 40 60 80 100<br />
Balance Inward Outward<br />
2013<br />
Structural and Policy Drivers of Depth of <strong>Connectedness</strong><br />
Structural Factors<br />
Rank<br />
Level<br />
GDP per Capita (+) 102/140 $3,010 <br />
Linguistic Commonality (+) 20/140 40% <br />
Remoteness (-) 45/140 6.1 <br />
Population (-) 7/140 173.6 <br />
Landlocked (-) – No <br />
General Policies / Environment<br />
Rank<br />
Level<br />
Operating Environment (+) 121/129 3.3 <br />
Infrastructure (+) 109/129 2.9 <br />
Press Freedom (+) 90/137 65 <br />
Labor Freedom (+) 51/140 66 <br />
Financial Freedom (+) 99/140 40 <br />
<strong>Global</strong>ization Policies<br />
Rank<br />
Level<br />
Enabling Trade <strong>Index</strong> (+) 122/129 3.1 <br />
Tariffs (Wtd. Mean Applied) (-) 15/138 10.6 <br />
Capital Account Openness (+) 89/135 0.3 <br />
Visa-Free Travel Outward (+) 115/139 49 <br />
Visa-Free Travel Inward (+) 126/140 15 <br />
– Not Applicable · Data Not Available (+) Positive Impact (-) Negative Impact


