

DHL Global Connectedness Index 2014
DHL Global Connectedness Index 2014
DHL Global Connectedness Index 2014
- No tags were found...

You also want an ePaper? Increase the reach of your titles
YUMPU automatically turns print PDFs into web optimized ePapers that Google loves.
<strong>DHL</strong> <strong>Global</strong> <strong>Connectedness</strong> <strong>Index</strong> <strong>2014</strong><br />
91<br />
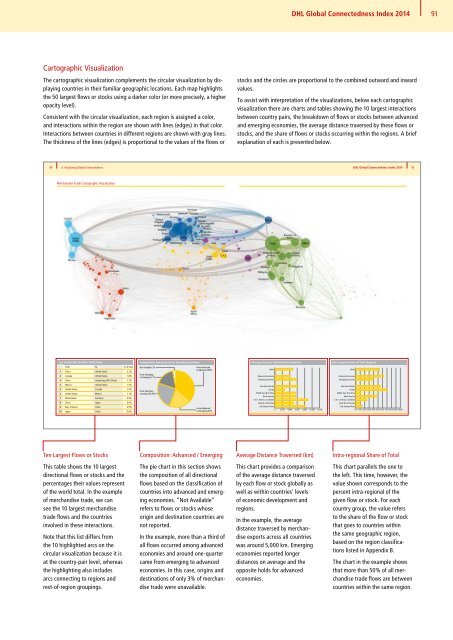
Cartographic Visualization<br />
The cartographic visualization complements the circular visualization by displaying<br />
countries in their familiar geographic locations. Each map highlights<br />
the 50 largest flows or stocks using a darker color (or more precisely, a higher<br />
opacity level).<br />
Consistent with the circular visualization, each region is assigned a color,<br />
and interactions within the region are shown with lines (edges) in that color.<br />
Interactions between countries in different regions are shown with gray lines.<br />
The thickness of the lines (edges) is proportional to the values of the flows or<br />
stocks and the circles are proportional to the combined outward and inward<br />
values.<br />
To assist with interpretation of the visualizations, below each cartographic<br />
visualization there are charts and tables showing the 10 largest interactions<br />
between country pairs, the breakdown of flows or stocks between advanced<br />
and emerging economies, the average distance traversed by these flows or<br />
stocks, and the share of flows or stocks occurring within the regions. A brief<br />
explanation of each is presented below.<br />
94<br />
94<br />
II.<br />
II.<br />
Visualizing<br />
Visualizing<br />
<strong>Global</strong><br />
<strong>Global</strong><br />
<strong>Connectedness</strong><br />
<strong>Connectedness</strong> <strong>DHL</strong><br />
<strong>DHL</strong><br />
<strong>Global</strong><br />
<strong>Global</strong><br />
<strong>Connectedness</strong><br />
<strong>Connectedness</strong><br />
<strong>Index</strong><br />
<strong>Index</strong><br />
<strong>2014</strong><br />
<strong>2014</strong><br />
95<br />
95<br />
Merchandise Merchandise Trade Trade Cartographic Cartographic Visualization Visualization<br />
Merchandise<br />
Merchandise<br />
Merchandise<br />
Ten Ten Largest Merchandise Trade Flows<br />
Composition: Advanced versus Emerging Economies<br />
Average Distance Traversed (km) (Exports)<br />
Intra-regional Share of Total (Exports)<br />
From To % of total<br />
From To of total<br />
1 China United States 2.2%<br />
China United States 2.2%<br />
2 Canada United States 1.8%<br />
Canada United States 1.8%<br />
3 China Hong Kong SAR (China) 1.7%<br />
China Hong Kong SAR 1.7%<br />
Not Not Available 3% 3%<br />
From From Emerging<br />
to to Emerging 17% 17%<br />
From Advanced<br />
to to Advanced 36%<br />
World<br />
World<br />
Advanced<br />
Advanced<br />
Economies<br />
Economies<br />
Emerging<br />
Emerging<br />
Economies<br />
Economies<br />
World<br />
World<br />
Advanced<br />
Advanced<br />
Economies<br />
Economies<br />
Emerging<br />
Emerging<br />
Economies<br />
Economies<br />
4 Mexico United States 1.5%<br />
5 United States Canada 1.5%<br />
States 6 United States Mexico 1.1%<br />
7 Netherlands Germany 0.9%<br />
8 China Japan 0.9%<br />
9 Rep. of Korea China 0.9%<br />
Rep. of 10 10 Japan China 0.8%<br />
From Emerging<br />
to to Advanced 24%<br />
From Advanced<br />
to to Emerging 20%<br />
East East Asia Asia & Pacific Pacific<br />
Europe<br />
Middle East East & N. N. Africa<br />
North America<br />
S. S. & C. C. America, Caribbean<br />
South & Central Asia<br />
Sub-Saharan Africa<br />
0 2,000 4,000 6,000 8,000 10,000 12,000<br />
East East Asia Asia & Pacific Pacific<br />
Europe Europe<br />
Middle Middle East East & N. N. Africa Africa<br />
North North America<br />
S. S. & C. C. America, Caribbean<br />
South & Central Asia Asia<br />
Sub-Saharan Africa<br />
0% 0% 10% 20% 30% 30% 40% 40% 50% 50% 60% 60% 70% 70% 80% 80% 90% 90% 100% 100%<br />
Ten Largest Flows or Stocks<br />
Composition: Advanced / Emerging<br />
Average Distance Traversed (km)<br />
Intra-regional Share of Total<br />
This table shows the 10 largest<br />
directional flows or stocks and the<br />
percentages their values represent<br />
of the world total. In the example<br />
of merchandise trade, we can<br />
see the 10 largest merchandise<br />
trade flows and the countries<br />
involved in these interactions.<br />
Note that this list differs from<br />
the 10 highlighted arcs on the<br />
circular visualization because it is<br />
at the country-pair level, whereas<br />
the highlighting also includes<br />
arcs connecting to regions and<br />
rest-of-region groupings.<br />
The pie chart in this section shows<br />
the composition of all directional<br />
flows based on the classification of<br />
countries into advanced and emerging<br />
economies. “Not Available”<br />
refers to flows or stocks whose<br />
origin and destination countries are<br />
not reported.<br />
In the example, more than a third of<br />
all flows occurred among advanced<br />
economies and around one-quarter<br />
came from emerging to advanced<br />
economies. In this case, origins and<br />
destinations of only 3% of merchandise<br />
trade were unavailable.<br />
This chart provides a comparison<br />
of the average distance traversed<br />
by each flow or stock globally as<br />
well as within countries’ levels<br />
of economic development and<br />
regions.<br />
In the example, the average<br />
distance traversed by merchandise<br />
exports across all countries<br />
was around 5,000 km. Emerging<br />
economies reported longer<br />
distances on average and the<br />
opposite holds for advanced<br />
economies.<br />
This chart parallels the one to<br />
the left. This time, however, the<br />
value shown corresponds to the<br />
percent intra-regional of the<br />
given flow or stock. For each<br />
country group, the value refers<br />
to the share of the flow or stock<br />
that goes to countries within<br />
the same geographic region,<br />
based on the region classifications<br />
listed in Appendix B.<br />
The chart in the example shows<br />
that more than 50% of all merchandise<br />
trade flows are between<br />
countries within the same region.


