

DHL Global Connectedness Index 2014
DHL Global Connectedness Index 2014
DHL Global Connectedness Index 2014
- No tags were found...

You also want an ePaper? Increase the reach of your titles
YUMPU automatically turns print PDFs into web optimized ePapers that Google loves.
80 5. <strong>DHL</strong> <strong>Global</strong> <strong>Connectedness</strong> <strong>Index</strong> Methodology<br />
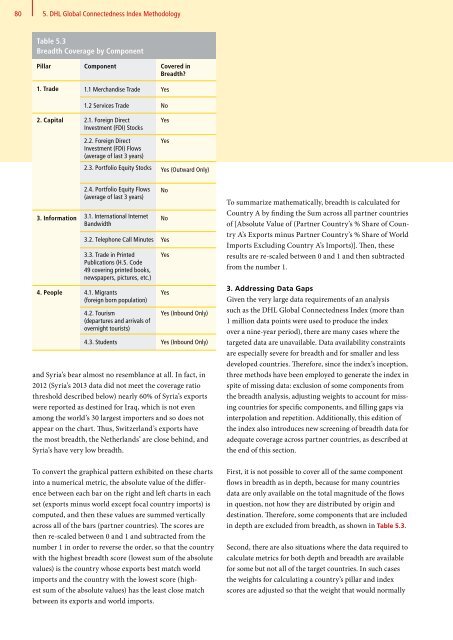
Table 5.3<br />
Breadth Coverage by Component<br />
Pillar Component Covered in<br />
Breadth<br />
1. Trade 1.1 Merchandise Trade Yes<br />
1.2 Services Trade No<br />
2. Capital 2.1. Foreign Direct<br />
Investment (FDI) Stocks<br />
2.2. Foreign Direct<br />
Investment (FDI) Flows<br />
(average of last 3 years)<br />
Yes<br />
Yes<br />
2.3. Portfolio Equity Stocks Yes (Outward Only)<br />
2.4. Portfolio Equity Flows<br />
(average of last 3 years)<br />
3. Information 3.1. International Internet<br />
Bandwidth<br />
and Syria’s bear almost no resemblance at all. In fact, in<br />
2012 (Syria’s 2013 data did not meet the coverage ratio<br />
threshold described below) nearly 60% of Syria’s exports<br />
were reported as destined for Iraq, which is not even<br />
among the world’s 30 largest importers and so does not<br />
appear on the chart. Thus, Switzerland’s exports have<br />
the most breadth, the Netherlands’ are close behind, and<br />
Syria’s have very low breadth.<br />
To convert the graphical pattern exhibited on these charts<br />
into a numerical metric, the absolute value of the difference<br />
between each bar on the right and left charts in each<br />
set (exports minus world except focal country imports) is<br />
computed, and then these values are summed vertically<br />
across all of the bars (partner countries). The scores are<br />
then re-scaled between 0 and 1 and subtracted from the<br />
number 1 in order to reverse the order, so that the country<br />
with the highest breadth score (lowest sum of the absolute<br />
values) is the country whose exports best match world<br />
imports and the country with the lowest score (highest<br />
sum of the absolute values) has the least close match<br />
between its exports and world imports.<br />
No<br />
No<br />
3.2. Telephone Call Minutes Yes<br />
3.3. Trade in Printed<br />
Publications (H.S. Code<br />
49 covering printed books,<br />
newspapers, pictures, etc.)<br />
4. People 4.1. Migrants<br />
(foreign born population)<br />
4.2. Tourism<br />
(departures and arrivals of<br />
overnight tourists)<br />
Yes<br />
Yes<br />
Yes (Inbound Only)<br />
4.3. Students Yes (Inbound Only)<br />
To summarize mathematically, breadth is calculated for<br />
Country A by finding the Sum across all partner countries<br />
of [Absolute Value of (Partner Country’s % Share of Country<br />
A’s Exports minus Partner Country’s % Share of World<br />
Imports Excluding Country A’s Imports)]. Then, these<br />
results are re-scaled between 0 and 1 and then subtracted<br />
from the number 1.<br />
3. Addressing Data Gaps<br />
Given the very large data requirements of an analysis<br />
such as the <strong>DHL</strong> <strong>Global</strong> <strong>Connectedness</strong> <strong>Index</strong> (more than<br />
1 million data points were used to produce the index<br />
over a nine-year period), there are many cases where the<br />
targeted data are unavailable. Data availability constraints<br />
are especially severe for breadth and for smaller and less<br />
developed countries. Therefore, since the index’s inception,<br />
three methods have been employed to generate the index in<br />
spite of missing data: exclusion of some components from<br />
the breadth analysis, adjusting weights to account for missing<br />
countries for specific components, and filling gaps via<br />
interpolation and repetition. Additionally, this edition of<br />
the index also introduces new screening of breadth data for<br />
adequate coverage across partner countries, as described at<br />
the end of this section.<br />
First, it is not possible to cover all of the same component<br />
flows in breadth as in depth, because for many countries<br />
data are only available on the total magnitude of the flows<br />
in question, not how they are distributed by origin and<br />
destination. Therefore, some components that are included<br />
in depth are excluded from breadth, as shown in Table 5.3.<br />
Second, there are also situations where the data required to<br />
calculate metrics for both depth and breadth are available<br />
for some but not all of the target countries. In such cases<br />
the weights for calculating a country’s pillar and index<br />
scores are adjusted so that the weight that would normally


