

DHL Global Connectedness Index 2014
DHL Global Connectedness Index 2014
DHL Global Connectedness Index 2014
- No tags were found...

You also want an ePaper? Increase the reach of your titles
YUMPU automatically turns print PDFs into web optimized ePapers that Google loves.
<strong>DHL</strong> <strong>Global</strong> <strong>Connectedness</strong> <strong>Index</strong> <strong>2014</strong><br />
135<br />
AZERBAIJAN<br />
Key Scores and Trends<br />
Rank<br />
Score<br />
2013 2011 Change 2013 2011 Change<br />
Overall 82/140 82/140 0 42/100 40/100 2<br />
Depth 79/140 83/140 4 22/50 20/50 2<br />
Breadth 79/140 77/140 -2 20/50 20/50 0<br />
Trade Pillar 94/140 88/140 -6 42/100 46/100 -4<br />
AZE<br />
Capital Pillar · · · · · ·<br />
Information Pillar 89/102 93/102 4 38/100 26/100 12<br />
People Pillar 54/109 57/109 3 54/100 50/100 4<br />
<strong>Connectedness</strong> Score Trend<br />
55<br />
50<br />
45<br />
40<br />
35<br />
30<br />
25<br />
2005<br />
2006<br />
2007<br />
2008<br />
2009<br />
2010<br />
2011<br />
2012<br />
2013<br />
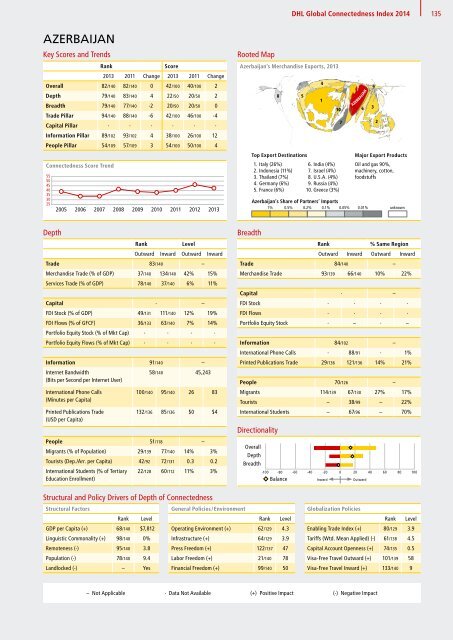
Rooted Map<br />
Rooted Map:<br />
Azerbaijan’s Azerbaijan’s Merchandise Merchandise Exports, Exports, 2013 2013<br />
8<br />
Top Export Destinations<br />
1. Italy (26%)<br />
2. Indonesia (11%)<br />
3. Thailand (7%)<br />
4. Germany (6%)<br />
5. France (6%)<br />
5<br />
4<br />
1<br />
AZERBAIJAN<br />
Azerbaijan’s Share of Partners’ Imports<br />
1% 0.5% 0.2% 0.1% 0.05% 0.01% unknown<br />
10<br />
6. India (4%)<br />
7. Israel (4%)<br />
8. U.S.A. (4%)<br />
9. Russia (4%)<br />
10. Greece (3%)<br />
7<br />
6<br />
9<br />
3<br />
2<br />
Major Export Products<br />
Oil and gas 90%,<br />
machinery, cotton,<br />
foodstuffs<br />
Depth<br />
Rank<br />
Level<br />
Outward Inward Outward Inward<br />
Trade 83/140 –<br />
Merchandise Trade (% of GDP) 37/140 134/140 42% 15%<br />
Services Trade (% of GDP) 78/140 37/140 6% 11%<br />
Capital · –<br />
FDI Stock (% of GDP) 49/131 111/140 12% 19%<br />
FDI Flows (% of GFCF) 36/133 63/140 7% 14%<br />
Portfolio Equity Stock (% of Mkt Cap) · · · ·<br />
Portfolio Equity Flows (% of Mkt Cap) · · · ·<br />
Information 91/140 –<br />
Internet Bandwidth<br />
58/140 45,243<br />
(Bits per Second per Internet User)<br />
International Phone Calls<br />
(Minutes per Capita)<br />
Printed Publications Trade<br />
(USD per Capita)<br />
100/140 95/140 26 83<br />
132/136 85/136 $0 $4<br />
People 51/118 –<br />
Migrants (% of Population) 29/139 77/140 14% 3%<br />
Tourists (Dep./Arr. per Capita) 42/92 72/131 0.3 0.2<br />
International Students (% of Tertiary<br />
Education Enrollment)<br />
22/128 60/112 11% 3%<br />
Breadth<br />
Rank<br />
% Same Region<br />
Outward Inward Outward Inward<br />
Trade 84/140 –<br />
Merchandise Trade 93/139 66/140 10% 22%<br />
Capital · –<br />
AZE<br />
FDI Stock · · · ·<br />
FDI Flows · · · ·<br />
Portfolio Equity Stock · – · –<br />
Information 84/102 –<br />
55<br />
International 50 Phone Calls · 88/91 · 1%<br />
45<br />
Printed 40 Publications Trade 29/136 121/136 14% 21%<br />
35<br />
30<br />
25<br />
People 2005 2006 2007 200870/126 2009 2010 2011 – 2012<br />
Migrants 114/139 67/130 27% 17%<br />
Tourists – 38/99 – 22%<br />
International Students – 67/96 – 70%<br />
Directionality<br />
Overall<br />
Depth<br />
Breadth<br />
-100 -80 -60 -40 -20 0 20 40 60 80 100<br />
Balance Inward Outward<br />
2013<br />
Structural and Policy Drivers of Depth of <strong>Connectedness</strong><br />
Structural Factors<br />
General Policies / Environment<br />
Rank Level<br />
Rank Level<br />
GDP per Capita (+) 68/140 $7,812 Operating Environment (+) 62/129 4.3<br />
Linguistic Commonality (+) 98/140 0% Infrastructure (+) 64/129 3.9<br />
Remoteness (-) 95/140 3.8 Press Freedom (+) 122/137 47<br />
Population (-) 78/140 9.4 Labor Freedom (+) 21/140 78<br />
Landlocked (-) – Yes Financial Freedom (+) 99/140 50<br />
<strong>Global</strong>ization Policies<br />
Rank Level<br />
Enabling Trade <strong>Index</strong> (+) 80/129 3.9<br />
Tariffs (Wtd. Mean Applied) (-) 61/138 4.5<br />
Capital Account Openness (+) 74/135 0.5<br />
Visa-Free Travel Outward (+) 101/139 58<br />
Visa-Free Travel Inward (+) 133/140 9<br />
– Not Applicable · Data Not Available (+) Positive Impact (-) Negative Impact


