

DHL Global Connectedness Index 2014
DHL Global Connectedness Index 2014
DHL Global Connectedness Index 2014
- No tags were found...

You also want an ePaper? Increase the reach of your titles
YUMPU automatically turns print PDFs into web optimized ePapers that Google loves.
86 5. <strong>DHL</strong> <strong>Global</strong> <strong>Connectedness</strong> <strong>Index</strong> Methodology<br />
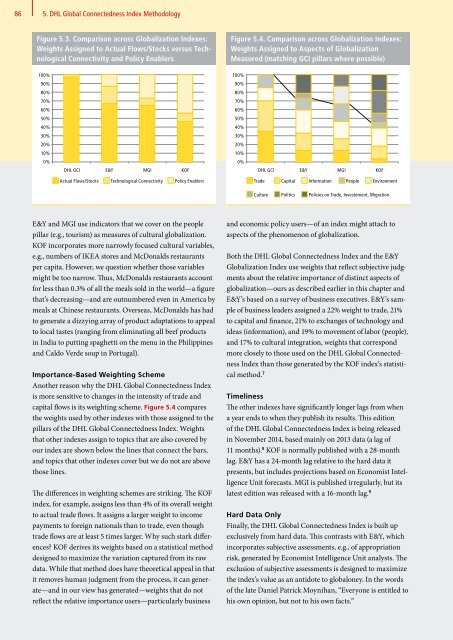
Figure 5.3. Comparison across <strong>Global</strong>ization <strong>Index</strong>es:<br />
Weights Assigned to Actual Flows/Stocks versus Technological<br />
Connectivity and Policy Enablers<br />
Figure 5.4. Comparison across <strong>Global</strong>ization <strong>Index</strong>es:<br />
Weights Assigned to Aspects of <strong>Global</strong>ization<br />
Measured (matching GCI pillars where possible)<br />
100%<br />
90%<br />
80%<br />
70%<br />
60%<br />
50%<br />
40%<br />
30%<br />
20%<br />
10%<br />
0%<br />
100%<br />
90%<br />
80%<br />
70%<br />
60%<br />
50%<br />
40%<br />
30%<br />
20%<br />
10%<br />
0%<br />
<strong>DHL</strong> GCI E&Y MGI KOF<br />
<strong>DHL</strong> GCI E&Y MGI KOF<br />
Actual Flows/Stocks Technological Connectivity Policy Enablers<br />
Trade Capital Information People Environment<br />
Culture Politics Policies on Trade, Investement, Migration<br />
E&Y and MGI use indicators that we cover on the people<br />
pillar (e.g., tourism) as measures of cultural globalization.<br />
KOF incorporates more narrowly focused cultural variables,<br />
e.g., numbers of IKEA stores and McDonalds restaurants<br />
per capita. However, we question whether those variables<br />
might be too narrow. Thus, McDonalds restaurants account<br />
for less than 0.3% of all the meals sold in the world—a figure<br />
that’s decreasing—and are outnumbered even in America by<br />
meals at Chinese restaurants. Overseas, McDonalds has had<br />
to generate a dizzying array of product adaptations to appeal<br />
to local tastes (ranging from eliminating all beef products<br />
in India to putting spaghetti on the menu in the Philippines<br />
and Caldo Verde soup in Portugal).<br />
Importance-Based Weighting Scheme<br />
Another reason why the <strong>DHL</strong> <strong>Global</strong> <strong>Connectedness</strong> <strong>Index</strong><br />
is more sensitive to changes in the intensity of trade and<br />
capital flows is its weighting scheme. Figure 5.4 compares<br />
the weights used by other indexes with those assigned to the<br />
pillars of the <strong>DHL</strong> <strong>Global</strong> <strong>Connectedness</strong> <strong>Index</strong>. Weights<br />
that other indexes assign to topics that are also covered by<br />
our index are shown below the lines that connect the bars,<br />
and topics that other indexes cover but we do not are above<br />
those lines.<br />
The differences in weighting schemes are striking. The KOF<br />
index, for example, assigns less than 4% of its overall weight<br />
to actual trade flows. It assigns a larger weight to income<br />
payments to foreign nationals than to trade, even though<br />
trade flows are at least 5 times larger. Why such stark differences<br />
KOF derives its weights based on a statistical method<br />
designed to maximize the variation captured from its raw<br />
data. While that method does have theoretical appeal in that<br />
it removes human judgment from the process, it can generate—and<br />
in our view has generated—weights that do not<br />
reflect the relative importance users—particularly business<br />
and economic policy users—of an index might attach to<br />
aspects of the phenomenon of globalization.<br />
Both the <strong>DHL</strong> <strong>Global</strong> <strong>Connectedness</strong> <strong>Index</strong> and the E&Y<br />
<strong>Global</strong>ization <strong>Index</strong> use weights that reflect subjective judgments<br />
about the relative importance of distinct aspects of<br />
globalization—ours as described earlier in this chapter and<br />
E&Y’s based on a survey of business executives. E&Y’s sample<br />
of business leaders assigned a 22% weight to trade, 21%<br />
to capital and finance, 21% to exchanges of technology and<br />
ideas (information), and 19% to movement of labor (people),<br />
and 17% to cultural integration, weights that correspond<br />
more closely to those used on the <strong>DHL</strong> <strong>Global</strong> <strong>Connectedness</strong><br />
<strong>Index</strong> than those generated by the KOF index’s statistical<br />
method. 7<br />
Timeliness<br />
The other indexes have significantly longer lags from when<br />
a year ends to when they publish its results. This edition<br />
of the <strong>DHL</strong> <strong>Global</strong> <strong>Connectedness</strong> <strong>Index</strong> is being released<br />
in November <strong>2014</strong>, based mainly on 2013 data (a lag of<br />
11 months). 8 KOF is normally published with a 28-month<br />
lag. E&Y has a 24-month lag relative to the hard data it<br />
presents, but includes projections based on Economist Intelligence<br />
Unit forecasts. MGI is published irregularly, but its<br />
latest edition was released with a 16-month lag. 9<br />
Hard Data Only<br />
Finally, the <strong>DHL</strong> <strong>Global</strong> <strong>Connectedness</strong> <strong>Index</strong> is built up<br />
exclusively from hard data. This contrasts with E&Y, which<br />
incorporates subjective assessments, e.g., of appropriation<br />
risk, generated by Economist Intelligence Unit analysts. The<br />
exclusion of subjective assessments is designed to maximize<br />
the index’s value as an antidote to globaloney. In the words<br />
of the late Daniel Patrick Moynihan, “Everyone is entitled to<br />
his own opinion, but not to his own facts.”


