

DHL Global Connectedness Index 2014
DHL Global Connectedness Index 2014
DHL Global Connectedness Index 2014
- No tags were found...

You also want an ePaper? Increase the reach of your titles
YUMPU automatically turns print PDFs into web optimized ePapers that Google loves.
<strong>DHL</strong> <strong>Global</strong> <strong>Connectedness</strong> <strong>Index</strong> <strong>2014</strong><br />
77<br />
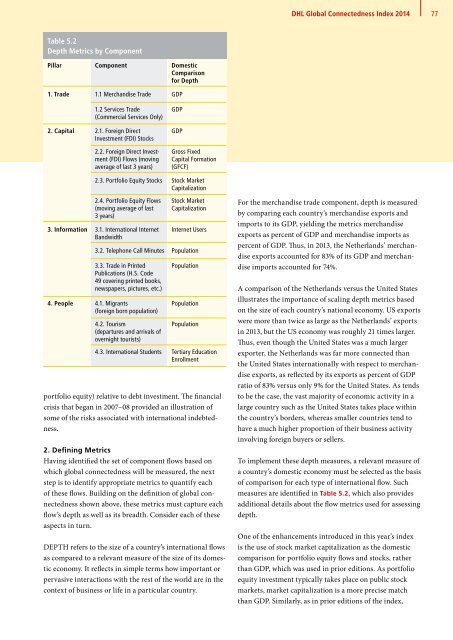
Table 5.2<br />
Depth Metrics by Component<br />
Pillar Component Domestic<br />
Comparison<br />
for Depth<br />
1. Trade 1.1 Merchandise Trade GDP<br />
1.2 Services Trade<br />
(Commercial Services Only)<br />
2. Capital 2.1. Foreign Direct<br />
Investment (FDI) Stocks<br />
2.2. Foreign Direct Investment<br />
(FDI) Flows (moving<br />
average of last 3 years)<br />
GDP<br />
GDP<br />
Gross Fixed<br />
Capital Formation<br />
(GFCF)<br />
2.3. Portfolio Equity Stocks Stock Market<br />
Capitalization<br />
2.4. Portfolio Equity Flows<br />
(moving average of last<br />
3 years)<br />
3. Information 3.1. International Internet<br />
Bandwidth<br />
Stock Market<br />
Capitalization<br />
Internet Users<br />
3.2. Telephone Call Minutes Population<br />
3.3. Trade in Printed<br />
Publications (H.S. Code<br />
49 covering printed books,<br />
newspapers, pictures, etc.)<br />
4. People 4.1. Migrants<br />
(foreign born population)<br />
4.2. Tourism<br />
(departures and arrivals of<br />
overnight tourists)<br />
Population<br />
Population<br />
Population<br />
4.3. International Students Tertiary Education<br />
Enrollment<br />
portfolio equity) relative to debt investment. The financial<br />
crisis that began in 2007–08 provided an illustration of<br />
some of the risks associated with international indebtedness.<br />
2. Defining Metrics<br />
Having identified the set of component flows based on<br />
which global connectedness will be measured, the next<br />
step is to identify appropriate metrics to quantify each<br />
of these flows. Building on the definition of global connectedness<br />
shown above, these metrics must capture each<br />
flow’s depth as well as its breadth. Consider each of these<br />
aspects in turn.<br />
DEPTH refers to the size of a country’s international flows<br />
as compared to a relevant measure of the size of its domestic<br />
economy. It reflects in simple terms how important or<br />
pervasive interactions with the rest of the world are in the<br />
context of business or life in a particular country.<br />
For the merchandise trade component, depth is measured<br />
by comparing each country’s merchandise exports and<br />
imports to its GDP, yielding the metrics merchandise<br />
exports as percent of GDP and merchandise imports as<br />
percent of GDP. Thus, in 2013, the Netherlands’ merchandise<br />
exports accounted for 83% of its GDP and merchandise<br />
imports accounted for 74%.<br />
A comparison of the Netherlands versus the United States<br />
illustrates the importance of scaling depth metrics based<br />
on the size of each country’s national economy. US exports<br />
were more than twice as large as the Netherlands’ exports<br />
in 2013, but the US economy was roughly 21 times larger.<br />
Thus, even though the United States was a much larger<br />
exporter, the Netherlands was far more connected than<br />
the United States internationally with respect to merchandise<br />
exports, as reflected by its exports as percent of GDP<br />
ratio of 83% versus only 9% for the United States. As tends<br />
to be the case, the vast majority of economic activity in a<br />
large country such as the United States takes place within<br />
the country’s borders, whereas smaller countries tend to<br />
have a much higher proportion of their business activity<br />
involving foreign buyers or sellers.<br />
To implement these depth measures, a relevant measure of<br />
a country’s domestic economy must be selected as the basis<br />
of comparison for each type of international flow. Such<br />
measures are identified in Table 5.2, which also provides<br />
additional details about the flow metrics used for assessing<br />
depth.<br />
One of the enhancements introduced in this year’s index<br />
is the use of stock market capitalization as the domestic<br />
comparison for portfolio equity flows and stocks, rather<br />
than GDP, which was used in prior editions. As portfolio<br />
equity investment typically takes place on public stock<br />
markets, market capitalization is a more precise match<br />
than GDP. Similarly, as in prior editions of the index,


