

DHL Global Connectedness Index 2014
DHL Global Connectedness Index 2014
DHL Global Connectedness Index 2014
- No tags were found...

Create successful ePaper yourself
Turn your PDF publications into a flip-book with our unique Google optimized e-Paper software.
<strong>DHL</strong> <strong>Global</strong> <strong>Connectedness</strong> <strong>Index</strong> <strong>2014</strong><br />
47<br />
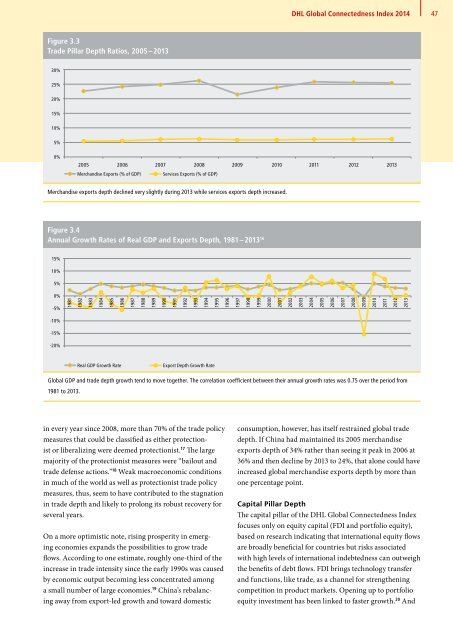
Figure 3.3<br />
Trade Pillar Depth Ratios, 2005 – 2013<br />
30%<br />
25%<br />
20%<br />
15%<br />
10%<br />
5%<br />
0%<br />
2005 2006 2007 2008 2009 2010 2011 2012 2013<br />
Merchandise Exports (% of GDP) Services Exports (% of GDP)<br />
Merchandise exports depth declined very slightly during 2013 while services exports depth increased.<br />
Figure 3.4<br />
Annual Growth Rates of Real GDP and Exports Depth, 1981 – 2013 16<br />
15%<br />
10%<br />
5%<br />
0%<br />
-5%<br />
1981<br />
1982<br />
1983<br />
1984<br />
1985<br />
1986<br />
1987<br />
1988<br />
1989<br />
1990<br />
1991<br />
1992<br />
1993<br />
1994<br />
1995<br />
1996<br />
1997<br />
1998<br />
1999<br />
2000<br />
2001<br />
2002<br />
2003<br />
2004<br />
2005<br />
2006<br />
2007<br />
2008<br />
2009<br />
2010<br />
2011<br />
2012<br />
2013<br />
-10%<br />
-15%<br />
-20%<br />
Real GDP Growth Rate<br />
Export Depth Growth Rate<br />
<strong>Global</strong> GDP and trade depth growth tend to move together. The correlation coefficient between their annual growth rates was 0.75 over the period from<br />
1981 to 2013.<br />
in every year since 2008, more than 70% of the trade policy<br />
measures that could be classified as either protectionist<br />
or liberalizing were deemed protectionist. 17 The large<br />
majority of the protectionist measures were “bailout and<br />
trade defense actions.” 18 Weak macroeconomic conditions<br />
in much of the world as well as protectionist trade policy<br />
measures, thus, seem to have contributed to the stagnation<br />
in trade depth and likely to prolong its robust recovery for<br />
several years.<br />
On a more optimistic note, rising prosperity in emerging<br />
economies expands the possibilities to grow trade<br />
flows. According to one estimate, roughly one-third of the<br />
increase in trade intensity since the early 1990s was caused<br />
by economic output becoming less concentrated among<br />
a small number of large economies. 19 China’s rebalancing<br />
away from export-led growth and toward domestic<br />
consumption, however, has itself restrained global trade<br />
depth. If China had maintained its 2005 merchandise<br />
exports depth of 34% rather than seeing it peak in 2006 at<br />
36% and then decline by 2013 to 24%, that alone could have<br />
increased global merchandise exports depth by more than<br />
one percentage point.<br />
Capital Pillar Depth<br />
The capital pillar of the <strong>DHL</strong> <strong>Global</strong> <strong>Connectedness</strong> <strong>Index</strong><br />
focuses only on equity capital (FDI and portfolio equity),<br />
based on research indicating that international equity flows<br />
are broadly beneficial for countries but risks associated<br />
with high levels of international indebtedness can outweigh<br />
the benefits of debt flows. FDI brings technology transfer<br />
and functions, like trade, as a channel for strengthening<br />
competition in product markets. Opening up to portfolio<br />
equity investment has been linked to faster growth. 20 And


