

DHL Global Connectedness Index 2014
DHL Global Connectedness Index 2014
DHL Global Connectedness Index 2014
- No tags were found...

Create successful ePaper yourself
Turn your PDF publications into a flip-book with our unique Google optimized e-Paper software.
<strong>DHL</strong> <strong>Global</strong> <strong>Connectedness</strong> <strong>Index</strong> <strong>2014</strong><br />
235<br />
ROMANIA<br />
Key Scores and Trends<br />
Rank<br />
Score<br />
2013 2011 Change 2013 2011 Change<br />
Overall 70/140 75/140 5 44/100 42/100 2<br />
Depth 77/140 79/140 2 23/50 21/50 2<br />
Breadth 75/140 73/140 -2 20/50 21/50 -1<br />
Trade Pillar 63/140 62/140 -1 51/100 53/100 -2<br />
ROU<br />
Capital Pillar 57/60 59/60 2 24/100 19/100 5<br />
Information Pillar 52/102 56/102 4 56/100 54/100 2<br />
People Pillar 35/109 36/109 1 66/100 65/100 1<br />
<strong>Connectedness</strong> Score Trend<br />
50<br />
45<br />
40<br />
35<br />
2005 2006 2007 2008 2009 2010 2011 2012 2013<br />
Rooted Map<br />
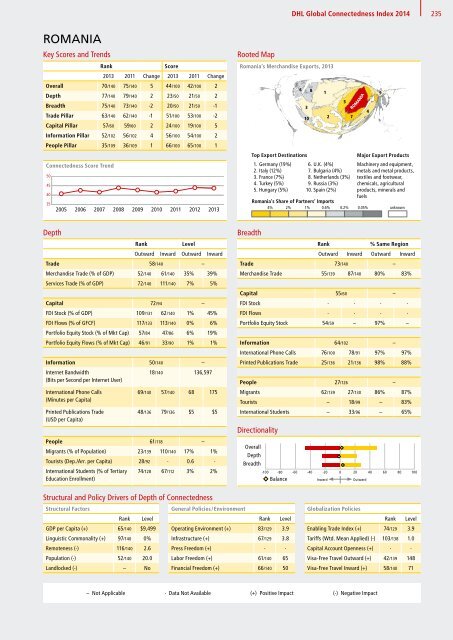
Rooted Map:<br />
Romania’s Romania’s Merchandise Merchandise Exports, Exports, 2013 2013<br />
6<br />
3<br />
10<br />
Top Export Destinations<br />
1. Germany (19%)<br />
2. Italy (12%)<br />
3. France (7%)<br />
4. Turkey (5%)<br />
5. Hungary (5%)<br />
8<br />
1<br />
2<br />
6. U.K. (4%)<br />
7. Bulgaria (4%)<br />
8. Netherlands (3%)<br />
9. Russia (3%)<br />
10. Spain (2%)<br />
ROMANIA<br />
Romania’s Share of Partners’ Imports<br />
4% 2% 1% 0.6% 0.2% 0.05% unknown<br />
5<br />
7<br />
4<br />
9<br />
Major Export Products<br />
Machinery and equipment,<br />
metals and metal products,<br />
textiles and footwear,<br />
chemicals, agricultural<br />
products, minerals and<br />
fuels<br />
Depth<br />
Rank<br />
Level<br />
Outward Inward Outward Inward<br />
Trade 58/140 –<br />
Merchandise Trade (% of GDP) 52/140 61/140 35% 39%<br />
Services Trade (% of GDP) 72/140 111/140 7% 5%<br />
Capital 72/94 –<br />
FDI Stock (% of GDP) 109/131 62/140 1% 45%<br />
FDI Flows (% of GFCF) 117/133 113/140 0% 6%<br />
Portfolio Equity Stock (% of Mkt Cap) 57/84 47/86 6% 19%<br />
Portfolio Equity Flows (% of Mkt Cap) 46/91 33/90 1% 1%<br />
Information 50/140 –<br />
Internet Bandwidth<br />
18/140 136,597<br />
(Bits per Second per Internet User)<br />
International Phone Calls<br />
(Minutes per Capita)<br />
Printed Publications Trade<br />
(USD per Capita)<br />
69/140 57/140 68 175<br />
48/136 79/136 $5 $5<br />
People 61/118 –<br />
Migrants (% of Population) 23/139 110/140 17% 1%<br />
Tourists (Dep./Arr. per Capita) 28/92 · 0.6 ·<br />
International Students (% of Tertiary<br />
Education Enrollment)<br />
74/128 67/112 3% 2%<br />
Breadth<br />
Rank<br />
% Same Region<br />
Outward Inward Outward Inward<br />
Trade 73/140 –<br />
Merchandise Trade 55/139 87/140 80% 83%<br />
Capital 55/60 –<br />
ROU<br />
FDI Stock · · · ·<br />
FDI Flows · · · ·<br />
Portfolio Equity Stock 54/59 – 97% –<br />
Information 64/102 –<br />
50<br />
International Phone Calls<br />
45<br />
Printed Publications Trade<br />
76/100<br />
25/136<br />
78/91<br />
21/136<br />
97%<br />
98%<br />
97%<br />
88%<br />
40<br />
35<br />
People 2005 2006 2007 200827/126 2009 2010 2011 – 2012 2013<br />
Migrants 62/139 27/130 86% 87%<br />
Tourists – 18/99 – 83%<br />
International Students – 33/96 – 65%<br />
Directionality<br />
Overall<br />
Depth<br />
Breadth<br />
-100 -80 -60 -40 -20 0 20 40 60 80 100<br />
Balance Inward Outward<br />
Structural and Policy Drivers of Depth of <strong>Connectedness</strong><br />
Structural Factors<br />
General Policies / Environment<br />
Rank Level<br />
Rank Level<br />
GDP per Capita (+) 65/140 $9,499 Operating Environment (+) 83/129 3.9<br />
Linguistic Commonality (+) 97/140 0% Infrastructure (+) 67/129 3.8<br />
Remoteness (-) 116/140 2.6 Press Freedom (+) · ·<br />
Population (-) 52/140 20.0 Labor Freedom (+) 61/140 65<br />
Landlocked (-) – No Financial Freedom (+) 66/140 50<br />
<strong>Global</strong>ization Policies<br />
Rank Level<br />
Enabling Trade <strong>Index</strong> (+) 74/129 3.9<br />
Tariffs (Wtd. Mean Applied) (-) 103/138 1.0<br />
Capital Account Openness (+) · ·<br />
Visa-Free Travel Outward (+) 42/139 148<br />
Visa-Free Travel Inward (+) 58/140 71<br />
– Not Applicable · Data Not Available (+) Positive Impact (-) Negative Impact


