

DHL Global Connectedness Index 2014
DHL Global Connectedness Index 2014
DHL Global Connectedness Index 2014
- No tags were found...

Create successful ePaper yourself
Turn your PDF publications into a flip-book with our unique Google optimized e-Paper software.
<strong>DHL</strong> <strong>Global</strong> <strong>Connectedness</strong> <strong>Index</strong> <strong>2014</strong><br />
89<br />
Having compiled what is probably the most comprehensive<br />
multi-flow dataset on globalization depth, distribution,<br />
and directionality—the 3 Ds—we enlisted the help of data<br />
visualization experts Dr. Rahul C. Basole and Hyunwoo<br />
Park of the Georgia Institute of Technology to depict the<br />
data visually. The pages that follow show the results of our<br />
collaboration with them on the eight kinds of flows and<br />
stocks for which adequate data are valuable.<br />
Two kinds of visualizations were created, circular and<br />
cartographic, using open-source Circos and Gephi software<br />
respectively, and data for the most recent year for all<br />
available countries, combined across outward and inward<br />
flows and stocks. 1 The two pages that follow provide a guide<br />
to understanding them. The guide is based on the specific<br />
example of merchandise trade, but the explanations<br />
apply to all eight index components covered since they are<br />
treated in parallel fashion.<br />
This two-page guide is followed by four pages of visualizations<br />
for each of the eight components. The first page of the<br />
four provides a summary of the results for the component<br />
being considered that places particular emphasis on comparing<br />
it with the other seven. This introduction is deliberately<br />
kept brief: the primary purpose of reproducing all the<br />
visualizations is to enable and indeed encourage the reader<br />
to draw his/her own conclusions.<br />
The introductory page for each index components is followed<br />
by a page that presents a circular visualization showing<br />
the interactions between countries and regions in terms<br />
of the index component being considered. More specifically,<br />
this visualization focuses on the 25 countries with<br />
the largest international flows or stocks (combined outward<br />
and inward) on the component being considered, arrayed<br />
by region. The top 25 account for a low of 46% of the global<br />
total for tourists to a high of 82% for trade in printed publications.<br />
Flows or stocks of countries not in the top 25 are<br />
included as well, but are aggregated up to the regional level.<br />
Below each circle is a key that explains the country/region<br />
labels arrayed around the circle.<br />
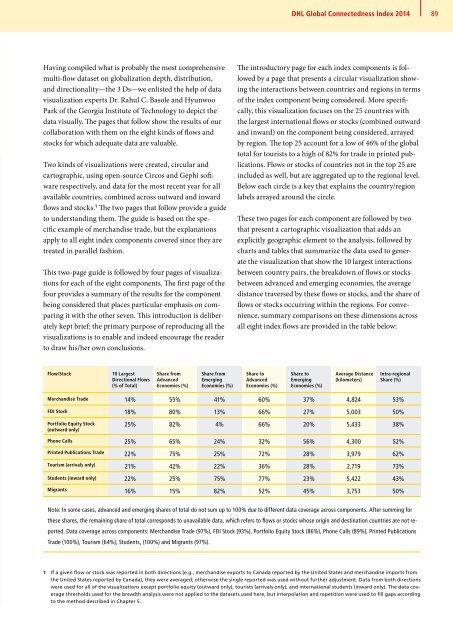
These two pages for each component are followed by two<br />
that present a cartographic visualization that adds an<br />
explicitly geographic element to the analysis, followed by<br />
charts and tables that summarize the data used to generate<br />
the visualization that show the 10 largest interactions<br />
between country pairs, the breakdown of flows or stocks<br />
between advanced and emerging economies, the average<br />
distance traversed by these flows or stocks, and the share of<br />
flows or stocks occurring within the regions. For convenience,<br />
summary comparisons on these dimensions across<br />
all eight index flows are provided in the table below:<br />
Flow/Stock<br />
10 Largest<br />
Directional Flows<br />
(% of Total)<br />
Share from<br />
Advanced<br />
Economies (%)<br />
Share from<br />
Emerging<br />
Economies (%)<br />
Share to<br />
Advanced<br />
Economies (%)<br />
Share to<br />
Emerging<br />
Economies (%)<br />
Average Distance<br />
(kilometers)<br />
Intra-regional<br />
Share (%)<br />
Merchandise Trade 14% 55% 41% 60% 37% 4,824 53%<br />
FDI Stock 18% 80% 13% 66% 27% 5,003 50%<br />
Portfolio Equity Stock<br />
(outward only)<br />
25% 82% 4% 66% 20% 5,433 38%<br />
Phone Calls 25% 65% 24% 32% 56% 4,300 52%<br />
Printed Publications Trade 22% 75% 25% 72% 28% 3,979 62%<br />
Tourism (arrivals only) 21% 42% 22% 36% 28% 2,719 73%<br />
Students (inward only) 22% 25% 75% 77% 23% 5,422 43%<br />
Migrants 16% 15% 82% 52% 45% 3,753 50%<br />
Note: In some cases, advanced and emerging shares of total do not sum up to 100% due to different data coverage across components. After summing for<br />
these shares, the remaining share of total corresponds to unavailable data, which refers to flows or stocks whose origin and destination countries are not reported.<br />
Data coverage across components: Merchandise Trade (97%), FDI Stock (93%), Portfolio Equity Stock (86%), Phone Calls (89%), Printed Publications<br />
Trade (100%), Tourism (64%), Students, (100%) and Migrants (97%).<br />
1 If a given flow or stock was reported in both directions (e.g., merchandise exports to Canada reported by the United States and merchandise imports from<br />
the United States reported by Canada), they were averaged; otherwise the single reported was used without further adjustment. Data from both directions<br />
were used for all of the visualizations except portfolio equity (outward only), tourists (arrivals only), and international students (inward only). The data coverage<br />
thresholds used for the breadth analysis were not applied to the datasets used here, but interpolation and repetition were used to fill gaps according<br />
to the method described in Chapter 5.


