

DHL Global Connectedness Index 2014
DHL Global Connectedness Index 2014
DHL Global Connectedness Index 2014
- No tags were found...

Create successful ePaper yourself
Turn your PDF publications into a flip-book with our unique Google optimized e-Paper software.
<strong>DHL</strong> <strong>Global</strong> <strong>Connectedness</strong> <strong>Index</strong> <strong>2014</strong><br />
127<br />
Key Rooted Scores Mapand Trends<br />
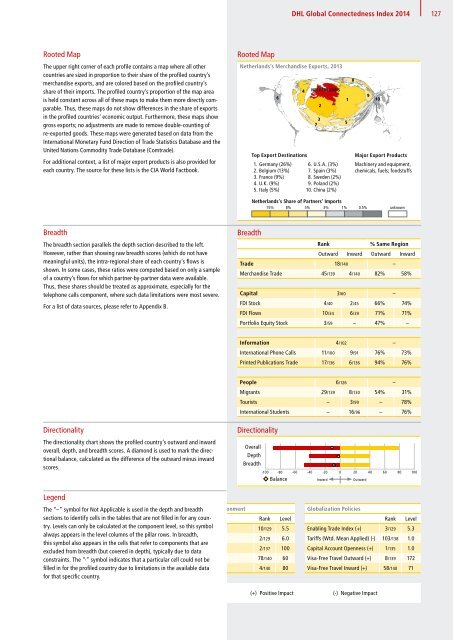
The upper right corner of each profile contains a map where all other<br />
countries are sized in proportion to their share of the profiled country’s<br />
merchandise exports, and are colored based on the profiled country’s<br />
share of their imports. The profiled country’s proportion of the map area<br />
is held constant across all of these maps to make them more directly comparable.<br />
Thus, these maps do not show differences in the share of exports<br />
in the profiled countries’ economic output. Furthermore, these maps show<br />
gross exports; no adjustments are made to remove double-counting of<br />
re-exported goods. These maps were generated based on data from the<br />
International Monetary Fund Direction of Trade Statistics Database and the<br />
United Nations Commodity Trade Database (Comtrade).<br />
For additional context, a list of major export products is also provided for<br />
<strong>Connectedness</strong> Score Trend<br />
each country. The source for these lists is the CIA World Factbook.<br />
Rooted Map<br />
Rooted Map:<br />
Netherlands’s Netherlands’s Merchandise Merchandise Exports, Exports, 2013 2013<br />
6<br />
Top Export Destinations<br />
1. Germany (26%)<br />
2. Belgium (13%)<br />
3. France (9%)<br />
4. U.K. (9%)<br />
5. Italy (5%)<br />
4<br />
NETHERLANDS<br />
2<br />
3<br />
7<br />
6. U.S.A. (3%)<br />
7. Spain (3%)<br />
8. Sweden (2%)<br />
9. Poland (2%)<br />
10. China (2%)<br />
5<br />
1<br />
8<br />
9<br />
10<br />
Major Export Products<br />
Machinery and equipment,<br />
chemicals, fuels; foodstuffs<br />
Netherlands’s Share of Partners’ Imports<br />
15% 8% 5% 3% 1% 0.5% unknown<br />
Depth Breadth<br />
The breadth section parallels the depth section described to the left.<br />
However, rather than showing raw breadth scores (which do not have<br />
meaningful units), the intra-regional share of each country’s flows is<br />
shown. In some cases, these ratios were computed based on only a sample<br />
of a country’s flows for which partner-by-partner data were available.<br />
Thus, these shares should be treated as approximate, especially for the<br />
telephone calls component, where such data limitations were most severe.<br />
For a list of data sources, please refer to Appendix B.<br />
Breadth<br />
Rank<br />
% Same Region<br />
Outward Inward Outward Inward<br />
Trade 18/140 –<br />
Merchandise Trade 45/139 4/140 82% 58%<br />
Capital 3/60 –<br />
NLD<br />
FDI Stock 4/40 2/45 66% 74%<br />
FDI Flows 10/34 6/39 71% 71%<br />
Portfolio Equity Stock 3/59 – 47% –<br />
Information 4/102 –<br />
95<br />
International Phone Calls 11/100 9/91 76% 73%<br />
90<br />
Printed Publications Trade 17/136 6/136 94% 76%<br />
85<br />
80<br />
People 2005 2006 2007 2008 6/126 2009 2010 2011 – 2012<br />
Migrants 29/139 8/130 54% 31%<br />
Tourists – 3/99 – 78%<br />
International Students – 16/96 – 76%<br />
2013<br />
Directionality<br />
The directionality chart shows the profiled country’s outward and inward<br />
overall, depth, and breadth scores. A diamond is used to mark the directional<br />
balance, calculated as the difference of the outward minus inward<br />
scores.<br />
Directionality<br />
Overall<br />
Depth<br />
Breadth<br />
-100 -80 -60 -40 -20 0 20 40 60 80 100<br />
Balance Inward Outward<br />
Structural Legend and Policy Drivers of Depth of <strong>Connectedness</strong><br />
The Structural “–” symbol Factors for Not Applicable is used in the depth General and breadth Policies / Environment<br />
sections to identify cells in the Rank tables that Level are not filled in for any country.<br />
GDP Levels per Capita can only (+) be calculated at the component level, Operating so this Environment symbol<br />
Rank<br />
10/129<br />
Level<br />
5.5<br />
always appears in the level columns of the pillar rows. In breadth,<br />
Linguistic Commonality (+) Infrastructure (+) 2/129 6.0<br />
this symbol also appears in the cells that refer to components that are<br />
Remoteness (-) Press Freedom (+) 2/137 100<br />
excluded from breadth (but covered in depth), typically due to data<br />
constraints. Population (-) The “·” symbol indicates that a particular cell Labor could Freedom not be (+)<br />
filled Landlocked in for the (-) profiled country due to limitations in the Financial available Freedom data (+)<br />
78/140<br />
4/140<br />
60<br />
80<br />
for that specific country.<br />
<strong>Global</strong>ization Policies<br />
Rank Level<br />
Enabling Trade <strong>Index</strong> (+) 3/129 5.3<br />
Tariffs (Wtd. Mean Applied) (-) 103/138 1.0<br />
Capital Account Openness (+) 1/135 1.0<br />
Visa-Free Travel Outward (+) 8/139 172<br />
Visa-Free Travel Inward (+) 58/140 71<br />
– Not Applicable · Data Not Available (+) Positive Impact (-) Negative Impact


