

DHL Global Connectedness Index 2014
DHL Global Connectedness Index 2014
DHL Global Connectedness Index 2014
- No tags were found...

Create successful ePaper yourself
Turn your PDF publications into a flip-book with our unique Google optimized e-Paper software.
<strong>DHL</strong> <strong>Global</strong> <strong>Connectedness</strong> <strong>Index</strong> <strong>2014</strong><br />
237<br />
RWANDA<br />
Key Scores and Trends<br />
Rank<br />
Score<br />
2013 2011 Change 2013 2011 Change<br />
Overall 133/140 135/140 2 19/100 19/100 0<br />
Depth 124/140 129/140 5 9/50 8/50 1<br />
Breadth 114/140 108/140 -6 10/50 11/50 -1<br />
Trade Pillar 129/140 130/140 1 25/100 27/100 -2<br />
RWA<br />
Capital Pillar · · · · · ·<br />
Information Pillar 93/102 92/102 -1 31/100 28/100 3<br />
People Pillar 104/109 104/109 0 25/100 25/100 0<br />
<strong>Connectedness</strong> Score Trend<br />
25<br />
20<br />
15<br />
10<br />
5<br />
0<br />
2005<br />
2006<br />
2007<br />
2008<br />
2009<br />
2010<br />
2011<br />
2012<br />
2013<br />
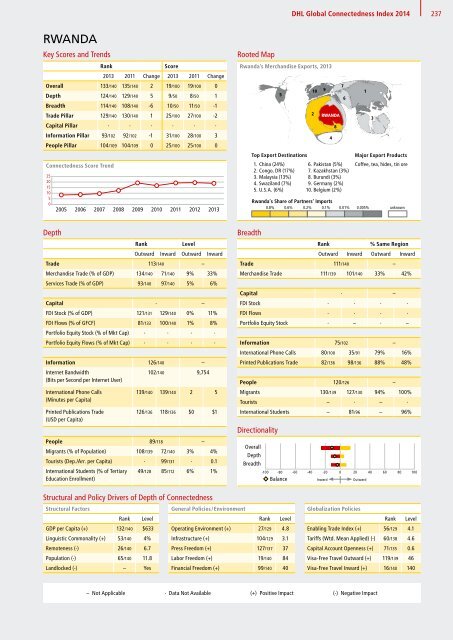
Rooted Map<br />
Rooted Map:<br />
Rwanda’s Rwanda’s Merchandise Merchandise Exports, Exports, 2013 2013<br />
Top Export Destinations<br />
5<br />
1. China (24%)<br />
2. Congo, DR (17%)<br />
3. Malaysia (13%)<br />
4. Swaziland (7%)<br />
5. U.S.A. (6%)<br />
10 9<br />
2<br />
RWANDA<br />
Rwanda’s Share of Partners’ Imports<br />
0.8% 0.6% 0.2% 0.1% 0.01% 0.005% unknown<br />
4<br />
8<br />
7<br />
6<br />
6. Pakistan (5%)<br />
7. Kazakhstan (3%)<br />
8. Burundi (3%)<br />
9. Germany (2%)<br />
10. Belgium (2%)<br />
1<br />
3<br />
Major Export Products<br />
Coffee, tea, hides, tin ore<br />
Depth<br />
Rank<br />
Level<br />
Outward Inward Outward Inward<br />
Trade 113/140 –<br />
Merchandise Trade (% of GDP) 134/140 71/140 9% 33%<br />
Services Trade (% of GDP) 93/140 97/140 5% 6%<br />
Capital · –<br />
FDI Stock (% of GDP) 121/131 129/140 0% 11%<br />
FDI Flows (% of GFCF) 81/133 100/140 1% 8%<br />
Portfolio Equity Stock (% of Mkt Cap) · · · ·<br />
Portfolio Equity Flows (% of Mkt Cap) · · · ·<br />
Information 126/140 –<br />
Internet Bandwidth<br />
102/140 9,754<br />
(Bits per Second per Internet User)<br />
International Phone Calls<br />
(Minutes per Capita)<br />
Printed Publications Trade<br />
(USD per Capita)<br />
139/140 139/140 2 5<br />
126/136 118/136 $0 $1<br />
People 89/118 –<br />
Migrants (% of Population) 108/139 72/140 3% 4%<br />
Tourists (Dep./Arr. per Capita) · 99/131 · 0.1<br />
International Students (% of Tertiary<br />
Education Enrollment)<br />
49/128 85/112 6% 1%<br />
Breadth<br />
Rank<br />
% Same Region<br />
Outward Inward Outward Inward<br />
Trade 111/140 –<br />
Merchandise Trade 111/139 101/140 33% 42%<br />
Capital · –<br />
RWA<br />
FDI Stock · · · ·<br />
FDI Flows · · · ·<br />
Portfolio Equity Stock · – · –<br />
Information 75/102 –<br />
25<br />
International 20 Phone Calls 80/100 35/91 79% 16%<br />
15<br />
Printed Publications Trade<br />
10<br />
82/136 98/136 88% 48%<br />
5<br />
0<br />
People 2005 2006 2007 2008120/126 2009 2010 2011 – 2012<br />
Migrants 130/139 127/130 94% 100%<br />
Tourists – · – ·<br />
International Students – 81/96 – 96%<br />
Directionality<br />
Overall<br />
Depth<br />
Breadth<br />
-100 -80 -60 -40 -20 0 20 40 60 80 100<br />
Balance Inward Outward<br />
2013<br />
Structural and Policy Drivers of Depth of <strong>Connectedness</strong><br />
Structural Factors<br />
General Policies / Environment<br />
Rank Level<br />
Rank Level<br />
GDP per Capita (+) 132/140 $633 Operating Environment (+) 27/129 4.8<br />
Linguistic Commonality (+) 53/140 4% Infrastructure (+) 104/129 3.1<br />
Remoteness (-) 26/140 6.7 Press Freedom (+) 127/137 37<br />
Population (-) 65/140 11.8 Labor Freedom (+) 19/140 84<br />
Landlocked (-) – Yes Financial Freedom (+) 99/140 40<br />
<strong>Global</strong>ization Policies<br />
Rank Level<br />
Enabling Trade <strong>Index</strong> (+) 56/129 4.1<br />
Tariffs (Wtd. Mean Applied) (-) 60/138 4.6<br />
Capital Account Openness (+) 71/135 0.6<br />
Visa-Free Travel Outward (+) 119/139 46<br />
Visa-Free Travel Inward (+) 16/140 140<br />
– Not Applicable · Data Not Available (+) Positive Impact (-) Negative Impact


