

DHL Global Connectedness Index 2014
DHL Global Connectedness Index 2014
DHL Global Connectedness Index 2014
- No tags were found...

Create successful ePaper yourself
Turn your PDF publications into a flip-book with our unique Google optimized e-Paper software.
<strong>DHL</strong> <strong>Global</strong> <strong>Connectedness</strong> <strong>Index</strong> <strong>2014</strong><br />
147<br />
BRUNEI DARUSSALAM<br />
Key Scores and Trends<br />
Rank<br />
Score<br />
2013 2011 Change 2013 2011 Change<br />
Overall 91/140 74/140 -17 39/100 43/100 -4<br />
Depth 36/140 31/140 -5 31/50 32/50 -1<br />
Breadth 126/140 112/140 -14 7/50 11/50 -4<br />
Trade Pillar 120/140 111/140 -9 32/100 36/100 -4<br />
BRN<br />
Capital Pillar · · · · · ·<br />
Information Pillar · · · · · ·<br />
People Pillar 37/109 37/109 0 66/100 65/100 1<br />
<strong>Connectedness</strong> Score Trend<br />
50<br />
45<br />
40<br />
35<br />
30<br />
2005 2006 2007 2008 2009 2010 2011 2012 2013<br />
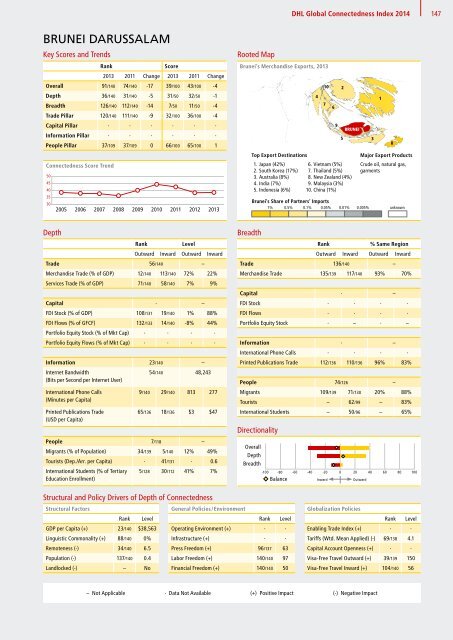
Rooted Map<br />
Rooted Map:<br />
Brunei’s Brunei’s Merchandise Merchandise Exports, Exports, 2013 2013<br />
Top Export Destinations<br />
1. Japan (42%)<br />
2. South Korea (17%)<br />
3. Australia (8%)<br />
4. India (7%)<br />
5. Indonesia (6%)<br />
4<br />
10<br />
7<br />
BRUNEI<br />
6. Vietnam (5%)<br />
7. Thailand (5%)<br />
8. New Zealand (4%)<br />
9. Malaysia (3%)<br />
10. China (1%)<br />
Brunei’s Share of Partners’ Imports<br />
1% 0.5% 0.1% 0.05% 0.01% 0.005% unknown<br />
6<br />
9<br />
2<br />
5<br />
3<br />
1<br />
Major Export Products<br />
Crude oil, natural gas,<br />
garments<br />
8<br />
Depth<br />
Rank<br />
Level<br />
Outward Inward Outward Inward<br />
Trade 56/140 –<br />
Merchandise Trade (% of GDP) 12/140 113/140 72% 22%<br />
Services Trade (% of GDP) 71/140 58/140 7% 9%<br />
Capital · –<br />
FDI Stock (% of GDP) 108/131 19/140 1% 88%<br />
FDI Flows (% of GFCF) 132/133 14/140 -8% 44%<br />
Portfolio Equity Stock (% of Mkt Cap) · · · ·<br />
Portfolio Equity Flows (% of Mkt Cap) · · · ·<br />
Information 23/140 –<br />
Internet Bandwidth<br />
54/140 48,243<br />
(Bits per Second per Internet User)<br />
International Phone Calls<br />
(Minutes per Capita)<br />
Printed Publications Trade<br />
(USD per Capita)<br />
9/140 29/140 813 277<br />
65/136 18/136 $3 $47<br />
People 7/118 –<br />
Migrants (% of Population) 34/139 5/140 12% 49%<br />
Tourists (Dep./Arr. per Capita) · 41/131 · 0.6<br />
International Students (% of Tertiary<br />
Education Enrollment)<br />
5/128 30/112 41% 7%<br />
Breadth<br />
Rank<br />
% Same Region<br />
Outward Inward Outward Inward<br />
Trade 136/140 –<br />
Merchandise Trade 135/139 117/140 93% 70%<br />
Capital · –<br />
BRN<br />
FDI Stock · · · ·<br />
FDI Flows · · · ·<br />
Portfolio Equity Stock · – · –<br />
Information · –<br />
50<br />
International Phone Calls<br />
45<br />
Printed 40 Publications Trade<br />
·<br />
112/136<br />
·<br />
110/136<br />
·<br />
96%<br />
·<br />
83%<br />
35<br />
30<br />
People 2005 2006 2007 200874/126 2009 2010 2011 – 2012 2013<br />
Migrants 109/139 71/130 20% 88%<br />
Tourists – 62/99 – 83%<br />
International Students – 50/96 – 65%<br />
Directionality<br />
Overall<br />
Depth<br />
Breadth<br />
-100 -80 -60 -40 -20 0 20 40 60 80 100<br />
Balance Inward Outward<br />
Structural and Policy Drivers of Depth of <strong>Connectedness</strong><br />
Structural Factors<br />
General Policies / Environment<br />
Rank Level<br />
Rank Level<br />
GDP per Capita (+) 23/140 $38,563 Operating Environment (+) · ·<br />
Linguistic Commonality (+) 88/140 0% Infrastructure (+) · ·<br />
Remoteness (-) 34/140 6.5 Press Freedom (+) 96/137 63<br />
Population (-) 137/140 0.4 Labor Freedom (+) 140/140 97<br />
Landlocked (-) – No Financial Freedom (+) 140/140 50<br />
<strong>Global</strong>ization Policies<br />
Rank Level<br />
Enabling Trade <strong>Index</strong> (+) · ·<br />
Tariffs (Wtd. Mean Applied) (-) 69/138 4.1<br />
Capital Account Openness (+) · ·<br />
Visa-Free Travel Outward (+) 39/139 150<br />
Visa-Free Travel Inward (+) 104/140 56<br />
– Not Applicable · Data Not Available (+) Positive Impact (-) Negative Impact


