

DHL Global Connectedness Index 2014
DHL Global Connectedness Index 2014
DHL Global Connectedness Index 2014
- No tags were found...

Create successful ePaper yourself
Turn your PDF publications into a flip-book with our unique Google optimized e-Paper software.
<strong>DHL</strong> <strong>Global</strong> <strong>Connectedness</strong> <strong>Index</strong> <strong>2014</strong><br />
239<br />
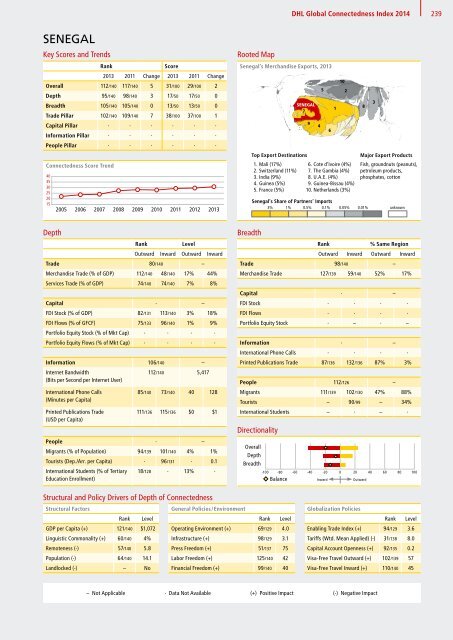
SENEGAL<br />
Key Scores and Trends<br />
Rank<br />
Score<br />
2013 2011 Change 2013 2011 Change<br />
Overall 112/140 117/140 5 31/100 29/100 2<br />
Depth 95/140 98/140 3 17/50 17/50 0<br />
Breadth 105/140 105/140 0 13/50 13/50 0<br />
Trade Pillar 102/140 109/140 7 38/100 37/100 1<br />
SEN<br />
Capital Pillar · · · · · ·<br />
Information Pillar · · · · · ·<br />
People Pillar · · · · · ·<br />
<strong>Connectedness</strong> Score Trend<br />
40<br />
35<br />
30<br />
25<br />
20<br />
15<br />
2005<br />
2006<br />
2007<br />
2008<br />
2009<br />
2010<br />
2011<br />
2012<br />
2013<br />
Rooted Map<br />
Rooted Map:<br />
Senegal’s Senegal’s Merchandise Merchandise Exports, Exports, 2013 2013<br />
SENEGAL<br />
7<br />
Top Export Destinations<br />
1. Mali (17%)<br />
2. Switzerland (11%)<br />
3. India (9%)<br />
4. Guinea (5%)<br />
5. France (5%)<br />
9<br />
4<br />
5<br />
6<br />
Senegal’s Share of Partners’ Imports<br />
3% 1% 0.5% 0.1% 0.05% 0.01% unknown<br />
1<br />
10<br />
6. Cote d’Ivoire (4%)<br />
7. The Gambia (4%)<br />
8. U.A.E. (4%)<br />
9. Guinea-Bissau (4%)<br />
10. Netherlands (3%)<br />
2<br />
8<br />
3<br />
Major Export Products<br />
Fish, groundnuts (peanuts),<br />
petroleum products,<br />
phosphates, cotton<br />
Depth<br />
Rank<br />
Level<br />
Outward Inward Outward Inward<br />
Trade 80/140 –<br />
Merchandise Trade (% of GDP) 112/140 48/140 17% 44%<br />
Services Trade (% of GDP) 74/140 74/140 7% 8%<br />
Capital · –<br />
FDI Stock (% of GDP) 82/131 113/140 3% 18%<br />
FDI Flows (% of GFCF) 75/133 96/140 1% 9%<br />
Portfolio Equity Stock (% of Mkt Cap) · · · ·<br />
Portfolio Equity Flows (% of Mkt Cap) · · · ·<br />
Information 106/140 –<br />
Internet Bandwidth<br />
112/140 5,417<br />
(Bits per Second per Internet User)<br />
International Phone Calls<br />
(Minutes per Capita)<br />
Printed Publications Trade<br />
(USD per Capita)<br />
85/140 73/140 40 128<br />
111/136 115/136 $0 $1<br />
People · –<br />
Migrants (% of Population) 94/139 101/140 4% 1%<br />
Tourists (Dep./Arr. per Capita) · 96/131 · 0.1<br />
International Students (% of Tertiary<br />
Education Enrollment)<br />
18/128 · 13% ·<br />
Breadth<br />
Rank<br />
% Same Region<br />
Outward Inward Outward Inward<br />
Trade 98/140 –<br />
Merchandise Trade 127/139 59/140 52% 17%<br />
Capital · –<br />
SEN<br />
FDI Stock · · · ·<br />
FDI Flows · · · ·<br />
Portfolio Equity Stock · – · –<br />
Information · –<br />
40<br />
International 35 Phone Calls · · · ·<br />
30<br />
Printed Publications Trade<br />
25<br />
87/136 132/136 87% 3%<br />
20<br />
15<br />
People 2005 2006 2007 2008112/126 2009 2010 2011 – 2012<br />
Migrants 111/139 102/130 47% 88%<br />
Tourists – 90/99 – 34%<br />
International Students – · – ·<br />
Directionality<br />
Overall<br />
Depth<br />
Breadth<br />
-100 -80 -60 -40 -20 0 20 40 60 80 100<br />
Balance Inward Outward<br />
2013<br />
Structural and Policy Drivers of Depth of <strong>Connectedness</strong><br />
Structural Factors<br />
General Policies / Environment<br />
Rank Level<br />
Rank Level<br />
GDP per Capita (+) 121/140 $1,072 Operating Environment (+) 69/129 4.0<br />
Linguistic Commonality (+) 60/140 4% Infrastructure (+) 98/129 3.1<br />
Remoteness (-) 57/140 5.8 Press Freedom (+) 51/137 75<br />
Population (-) 64/140 14.1 Labor Freedom (+) 125/140 42<br />
Landlocked (-) – No Financial Freedom (+) 99/140 40<br />
<strong>Global</strong>ization Policies<br />
Rank Level<br />
Enabling Trade <strong>Index</strong> (+) 94/129 3.6<br />
Tariffs (Wtd. Mean Applied) (-) 31/138 8.0<br />
Capital Account Openness (+) 92/135 0.2<br />
Visa-Free Travel Outward (+) 102/139 57<br />
Visa-Free Travel Inward (+) 110/140 45<br />
– Not Applicable · Data Not Available (+) Positive Impact (-) Negative Impact


