

DHL Global Connectedness Index 2014
DHL Global Connectedness Index 2014
DHL Global Connectedness Index 2014
- No tags were found...

You also want an ePaper? Increase the reach of your titles
YUMPU automatically turns print PDFs into web optimized ePapers that Google loves.
<strong>DHL</strong> <strong>Global</strong> <strong>Connectedness</strong> <strong>Index</strong> <strong>2014</strong><br />
15<br />
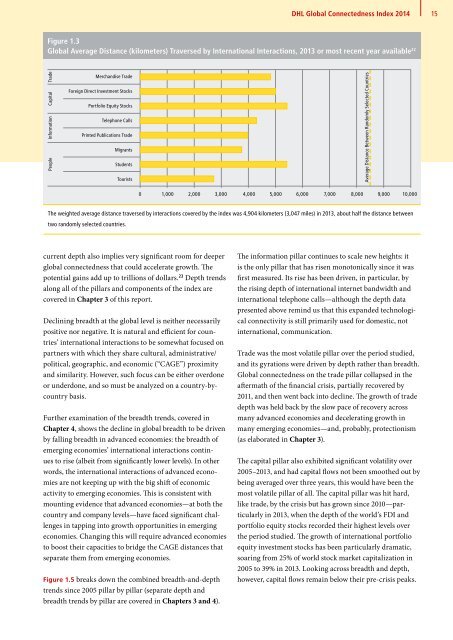
Figure 1.3<br />
<strong>Global</strong> Average Distance (kilometers) Traversed by International Interactions, 2013 or most recent year available 22<br />
People Information Capital Trade<br />
Merchandise Trade<br />
Foreign Direct Investment Stocks<br />
Portfolio Equity Stocks<br />
Telephone Calls<br />
Printed Publications Trade<br />
Migrants<br />
Students<br />
Tourists<br />
Average Distance Between Randomly Selected Countries<br />
0 1,000 2,000 3,000 4,000 5,000 6,000 7,000 8,000 9,00010,000<br />
The weighted average distance traversed by interactions covered by the index was 4,904 kilometers (3,047 miles) in 2013, about half the distance between<br />
two randomly selected countries.<br />
current depth also implies very significant room for deeper<br />
global connectedness that could accelerate growth. The<br />
potential gains add up to trillions of dollars. 23 Depth trends<br />
along all of the pillars and components of the index are<br />
covered in Chapter 3 of this report. 22<br />
Declining breadth at the global level is neither necessarily<br />
positive nor negative. It is natural and efficient for countries’<br />
international interactions to be somewhat focused on<br />
partners with which they share cultural, administrative/<br />
political, geographic, and economic (“CAGE”) proximity<br />
and similarity. However, such focus can be either overdone<br />
or underdone, and so must be analyzed on a country-bycountry<br />
basis.<br />
Further examination of the breadth trends, covered in<br />
Chapter 4, shows the decline in global breadth to be driven<br />
by falling breadth in advanced economies: the breadth of<br />
emerging economies’ international interactions continues<br />
to rise (albeit from significantly lower levels). In other<br />
words, the international interactions of advanced economies<br />
are not keeping up with the big shift of economic<br />
activity to emerging economies. This is consistent with<br />
mounting evidence that advanced economies—at both the<br />
country and company levels—have faced significant challenges<br />
in tapping into growth opportunities in emerging<br />
economies. Changing this will require advanced economies<br />
to boost their capacities to bridge the CAGE distances that<br />
separate them from emerging economies.<br />
Figure 1.5 breaks down the combined breadth-and-depth<br />
trends since 2005 pillar by pillar (separate depth and<br />
breadth trends by pillar are covered in Chapters 3 and 4).<br />
The information pillar continues to scale new heights: it<br />
is the only pillar that has risen monotonically since it was<br />
first measured. Its rise has been driven, in particular, by<br />
the rising depth of international internet bandwidth and<br />
international telephone calls—although the depth data<br />
presented above remind us that this expanded technological<br />
connectivity is still primarily used for domestic, not<br />
international, communication.<br />
Trade was the most volatile pillar over the period studied,<br />
and its gyrations were driven by depth rather than breadth.<br />
<strong>Global</strong> connectedness on the trade pillar collapsed in the<br />
aftermath of the financial crisis, partially recovered by<br />
2011, and then went back into decline. The growth of trade<br />
depth was held back by the slow pace of recovery across<br />
many advanced economies and decelerating growth in<br />
many emerging economies—and, probably, protectionism<br />
(as elaborated in Chapter 3).<br />
The capital pillar also exhibited significant volatility over<br />
2005–2013, and had capital flows not been smoothed out by<br />
being averaged over three years, this would have been the<br />
most volatile pillar of all. The capital pillar was hit hard,<br />
like trade, by the crisis but has grown since 2010—particularly<br />
in 2013, when the depth of the world’s FDI and<br />
portfolio equity stocks recorded their highest levels over<br />
the period studied. The growth of international portfolio<br />
equity investment stocks has been particularly dramatic,<br />
soaring from 25% of world stock market capitalization in<br />
2005 to 39% in 2013. Looking across breadth and depth,<br />
however, capital flows remain below their pre-crisis peaks.


