

DHL Global Connectedness Index 2014
DHL Global Connectedness Index 2014
DHL Global Connectedness Index 2014
- No tags were found...

You also want an ePaper? Increase the reach of your titles
YUMPU automatically turns print PDFs into web optimized ePapers that Google loves.
62 4. The Breadth of <strong>Global</strong> <strong>Connectedness</strong><br />
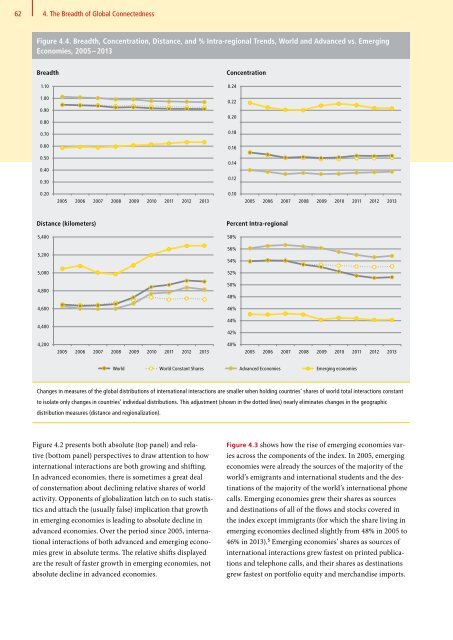
Figure 4.4. Breadth, Concentration, Distance, and % Intra-regional Trends, World and Advanced vs. Emerging<br />
Economies, 2005 – 2013<br />
Breadth<br />
1.10<br />
1.00<br />
0.90<br />
0.80<br />
0.70<br />
0.60<br />
0.50<br />
0.40<br />
0.30<br />
Concentration<br />
0.24<br />
0.22<br />
0.20<br />
0.18<br />
0.16<br />
0.14<br />
0.12<br />
0.20<br />
2005 2006 2007 2008 2009 2010 2011 2012 2013<br />
0.10<br />
2005 2006 2007 2008 2009 2010 2011 2012 2013<br />
Distance (kilometers)<br />
5,400<br />
5,200<br />
5,000<br />
4,800<br />
4,600<br />
4,400<br />
Percent Intra-regional<br />
58%<br />
56%<br />
54%<br />
52%<br />
50%<br />
48%<br />
46%<br />
44%<br />
42%<br />
4,200<br />
2005 2006 2007 2008 2009 2010 2011 2012 2013<br />
40%<br />
2005 2006 2007 2008 2009 2010 2011 2012 2013<br />
World World Constant Shares Advanced Economies Emerging economies<br />
Changes in measures of the global distributions of international interactions are smaller when holding countries’ shares of world total interactions constant<br />
to isolate only changes in countries’ individual distributions. This adjustment (shown in the dotted lines) nearly eliminates changes in the geographic<br />
distribution measures (distance and regionalization).<br />
Figure 4.2 presents both absolute (top panel) and relative<br />
(bottom panel) perspectives to draw attention to how<br />
international interactions are both growing and shifting.<br />
In advanced economies, there is sometimes a great deal<br />
of consternation about declining relative shares of world<br />
activity. Opponents of globalization latch on to such statistics<br />
and attach the (usually false) implication that growth<br />
in emerging economies is leading to absolute decline in<br />
advanced economies. Over the period since 2005, international<br />
interactions of both advanced and emerging economies<br />
grew in absolute terms. The relative shifts displayed<br />
are the result of faster growth in emerging economies, not<br />
absolute decline in advanced economies. 4<br />
Figure 4.3 shows how the rise of emerging economies varies<br />
across the components of the index. In 2005, emerging<br />
economies were already the sources of the majority of the<br />
world’s emigrants and international students and the destinations<br />
of the majority of the world’s international phone<br />
calls. Emerging economies grew their shares as sources<br />
and destinations of all of the flows and stocks covered in<br />
the index except immigrants (for which the share living in<br />
emerging economies declined slightly from 48% in 2005 to<br />
46% in 2013). 5 Emerging economies’ shares as sources of<br />
international interactions grew fastest on printed publications<br />
and telephone calls, and their shares as destinations<br />
grew fastest on portfolio equity and merchandise imports.


