

DHL Global Connectedness Index 2014
DHL Global Connectedness Index 2014
DHL Global Connectedness Index 2014
- No tags were found...

Create successful ePaper yourself
Turn your PDF publications into a flip-book with our unique Google optimized e-Paper software.
70 4. The Breadth of <strong>Global</strong> <strong>Connectedness</strong><br />
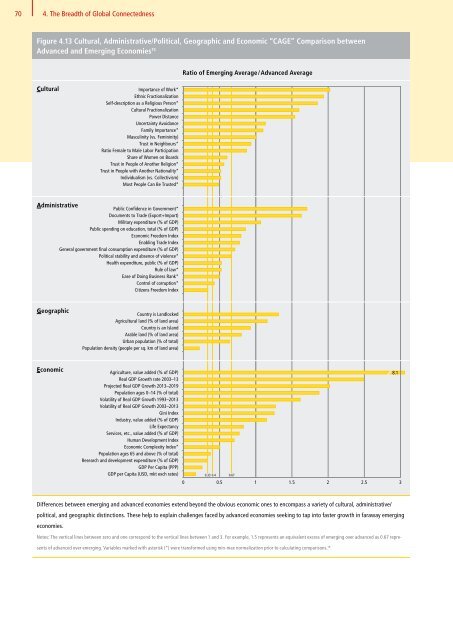
Figure 4.13 Cultural, Administrative/Political, Geographic and Economic “CAGE” Comparison between<br />
Advanced and Emerging Economies 15<br />
Ratio of Emerging Average / Advanced Average<br />
Cultural<br />
Importance of Work*<br />
Ethnic Fractionalization<br />
Self-description as a Religious Person*<br />
Cultural Fractionalization<br />
Power Distance<br />
Uncertainty Avoidance<br />
Family Importance*<br />
Masculinity (vs. Femininity)<br />
Trust in Neighbours*<br />
Ratio Female to Male Labor Participation<br />
Share of Women on Boards<br />
Trust in People of Another Religion*<br />
Trust in People with Another Nationality*<br />
Individualism (vs. Collectivism)<br />
Most People Can Be Trusted*<br />
Administrative<br />
Public Confidence in Government*<br />
Documents to Trade (Export+Import)<br />
Military expenditure (% of GDP)<br />
Public spending on education, total (% of GDP)<br />
Economic Freedom <strong>Index</strong><br />
Enabling Trade <strong>Index</strong><br />
General government final consumption expenditure (% of GDP)<br />
Political stability and absence of violence*<br />
Health expenditure, public (% of GDP)<br />
Rule of law*<br />
Ease of Doing Business Rank*<br />
Control of corruption*<br />
Citizens Freedom <strong>Index</strong><br />
Geographic<br />
Country is Landlocked<br />
Agricultural land (% of land area)<br />
Country is an Island<br />
Arable land (% of land area)<br />
Urban population (% of total)<br />
Population density (people per sq. km of land area)<br />
Economic<br />
Agriculture, value added (% of GDP)<br />
Real GDP Growth rate 2003–13<br />
Projected Real GDP Growth 2013–2019<br />
Population ages 0–14 (% of total)<br />
Volatility of Real GDP Growth 1993–2013<br />
Volatility of Real GDP Growth 2003–2013<br />
Gini <strong>Index</strong><br />
Industry, value added (% of GDP)<br />
Life Expectancy<br />
Services, etc., value added (% of GDP)<br />
Human Development <strong>Index</strong><br />
Economic Complexity <strong>Index</strong>*<br />
Population ages 65 and above (% of total)<br />
Research and development expenditure (% of GDP)<br />
GDP Per Capita (PPP)<br />
GDP per Capita (USD, mkt exch rates)<br />
0.33 0.4<br />
0 0.5<br />
0.67<br />
1 1.5 2 2.5 3<br />
8.1<br />
Differences between emerging and advanced economies extend beyond the obvious economic ones to encompass a variety of cultural, administrative/<br />
political, and geographic distinctions. These help to explain challenges faced by advanced economies seeking to tap into faster growth in faraway emerging<br />
economies.<br />
Notes: The vertical lines between zero and one correspond to the vertical lines between 1 and 3. For example, 1.5 represents an equivalent excess of emerging over advanced as 0.67 represents<br />
of advanced over emerging. Variables marked with asterisk (*) were transformed using min-max normalization prior to calculating comparisons. 16


