

DHL Global Connectedness Index 2014
DHL Global Connectedness Index 2014
DHL Global Connectedness Index 2014
- No tags were found...

Create successful ePaper yourself
Turn your PDF publications into a flip-book with our unique Google optimized e-Paper software.
60 4. The Breadth of <strong>Global</strong> <strong>Connectedness</strong><br />
Figure 4.1. Breadth, Concentration, Distance,<br />
and % Intra-regional, Changes versus 2005 Baseline 1<br />
108%<br />
106%<br />
104%<br />
102%<br />
100%<br />
98%<br />
96%<br />
94%<br />
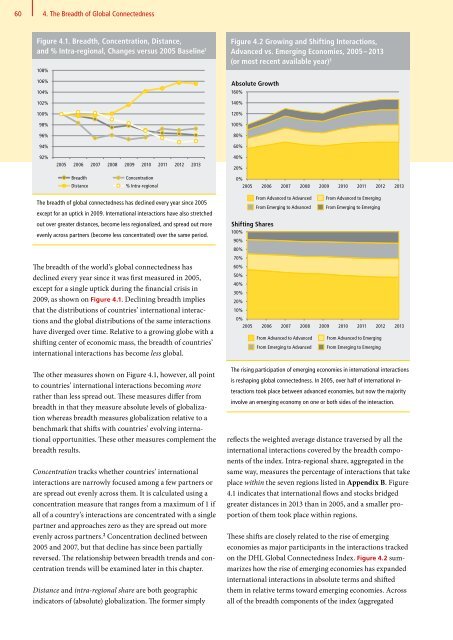
Figure 4.2 Growing and Shifting Interactions,<br />
Advanced vs. Emerging Economies, 2005 – 2013<br />
(or most recent available year) 3<br />
Absolute Growth<br />
160%<br />
140%<br />
120%<br />
100%<br />
80%<br />
60%<br />
92%<br />
2005 2006 2007 2008 2009 2010 2011 2012 2013<br />
40%<br />
20%<br />
Breadth<br />
Distance<br />
Concentration<br />
% Intra-regional<br />
0%<br />
2005 2006 2007 2008 2009 2010 2011 2012 2013<br />
The breadth of global connectedness has declined every year since 2005<br />
except for an uptick in 2009. International interactions have also stretched<br />
out over greater distances, become less regionalized, and spread out more<br />
evenly across partners (become less concentrated) over the same period.<br />
From Advanced to Advanced<br />
From Emerging to Advanced<br />
Shifting Shares<br />
100%<br />
90%<br />
80%<br />
From Advanced to Emerging<br />
From Emerging to Emerging<br />
The breadth of the world’s global connectedness has<br />
declined every year since it was first measured in 2005,<br />
except for a single uptick during the financial crisis in<br />
2009, as shown on Figure 4.1. Declining breadth implies<br />
that the distributions of countries’ international interactions<br />
and the global distributions of the same interactions<br />
have diverged over time. Relative to a growing globe with a<br />
shifting center of economic mass, the breadth of countries’<br />
international interactions has become less global. 1<br />
The other measures shown on Figure 4.1, however, all point<br />
to countries’ international interactions becoming more<br />
rather than less spread out. These measures differ from<br />
breadth in that they measure absolute levels of globalization<br />
whereas breadth measures globalization relative to a<br />
benchmark that shifts with countries’ evolving international<br />
opportunities. These other measures complement the<br />
breadth results.<br />
Concentration tracks whether countries’ international<br />
interactions are narrowly focused among a few partners or<br />
are spread out evenly across them. It is calculated using a<br />
concentration measure that ranges from a maximum of 1 if<br />
all of a country’s interactions are concentrated with a single<br />
partner and approaches zero as they are spread out more<br />
evenly across partners. 2 Concentration declined between<br />
2005 and 2007, but that decline has since been partially<br />
reversed. The relationship between breadth trends and concentration<br />
trends will be examined later in this chapter.<br />
Distance and intra-regional share are both geographic<br />
indicators of (absolute) globalization. The former simply<br />
70%<br />
60%<br />
50%<br />
40%<br />
30%<br />
20%<br />
10%<br />
0%<br />
2005 2006 2007 2008 2009 2010 2011 2012 2013<br />
From Advanced to Advanced<br />
From Emerging to Advanced<br />
From Advanced to Emerging<br />
From Emerging to Emerging<br />
The rising participation of emerging economies in international interactions<br />
is reshaping global connectedness. In 2005, over half of international interactions<br />
took place between advanced economies, but now the majority<br />
involve an emerging economy on one or both sides of the interaction.<br />
reflects the weighted average distance traversed by all the<br />
international interactions covered by the breadth components<br />
of the index. Intra-regional share, aggregated in the<br />
same way, measures the percentage of interactions that take<br />
place within the seven regions listed in Appendix B. Figure<br />
4.1 indicates that international flows and stocks bridged<br />
greater distances in 2013 than in 2005, and a smaller proportion<br />
of them took place within regions.<br />
These shifts are closely related to the rise of emerging<br />
economies as major participants in the interactions tracked<br />
on the <strong>DHL</strong> <strong>Global</strong> <strong>Connectedness</strong> <strong>Index</strong>. Figure 4.2 summarizes<br />
how the rise of emerging economies has expanded<br />
international interactions in absolute terms and shifted<br />
them in relative terms toward emerging economies. Across<br />
all of the breadth components of the index (aggregated


