

Poverty and Human Development Report 2009 - UNDP in Tanzania
Poverty and Human Development Report 2009 - UNDP in Tanzania
Poverty and Human Development Report 2009 - UNDP in Tanzania

You also want an ePaper? Increase the reach of your titles
YUMPU automatically turns print PDFs into web optimized ePapers that Google loves.
Access to Healthcare Services<br />
On the dem<strong>and</strong> side, improved health outcomes are dependent on effective access to quality<br />
health services. On the supply side, health facilities must have sufficient skilled health workers<br />
<strong>and</strong> adequate <strong>in</strong>frastructure, utilities, <strong>and</strong> medical equipment <strong>and</strong> supplies to deliver quality<br />
care. The follow<strong>in</strong>g sections, therefore, present recent data on utilisation <strong>and</strong> staff<strong>in</strong>g of health<br />
services.<br />
Utilisation<br />
The Household Budget Surveys <strong>in</strong> 2000/01 <strong>and</strong> 2007 collected data on healthcare consultations<br />
of survey participants. This permits a national estimate of recent changes <strong>in</strong> overall (curative)<br />
healthcare utilisation <strong>and</strong> the workload of the government healthcare system.<br />
Data <strong>in</strong>dicate no changes <strong>in</strong> self-reported morbidity or <strong>in</strong> the frequency that <strong>Tanzania</strong>ns consult<br />
a healthcare provider when ill. However, government facilities accounted for a higher share of<br />
healthcare consultations <strong>in</strong> 2007 than <strong>in</strong> 2000/1, while consultations at mission facilities <strong>and</strong> with<br />
private doctors dim<strong>in</strong>ished. F<strong>in</strong>d<strong>in</strong>gs <strong>in</strong>dicate a modest (11%) <strong>in</strong>crease <strong>in</strong> per capita (curative)<br />
healthcare consultations at government cl<strong>in</strong>ics (Table 15)<br />
There was no significant difference between males <strong>and</strong> females <strong>in</strong> the likelihood of seek<strong>in</strong>g<br />
healthcare when ill. However, the proportion who sought care <strong>in</strong> urban areas (75.8%) was nearly<br />
ten percentage po<strong>in</strong>ts higher than <strong>in</strong> rural areas (66.5%), a disparity that has rema<strong>in</strong>ed more or<br />
less unchanged s<strong>in</strong>ce 2000/01.<br />
Factor<strong>in</strong>g <strong>in</strong> population growth <strong>in</strong> the <strong>in</strong>terven<strong>in</strong>g years, the gross number of healthcare<br />
consultations at government cl<strong>in</strong>ics has <strong>in</strong>creased by 27% from around 44 million per year to<br />
over 55 million per year between 2000/01 <strong>and</strong> 2007.<br />
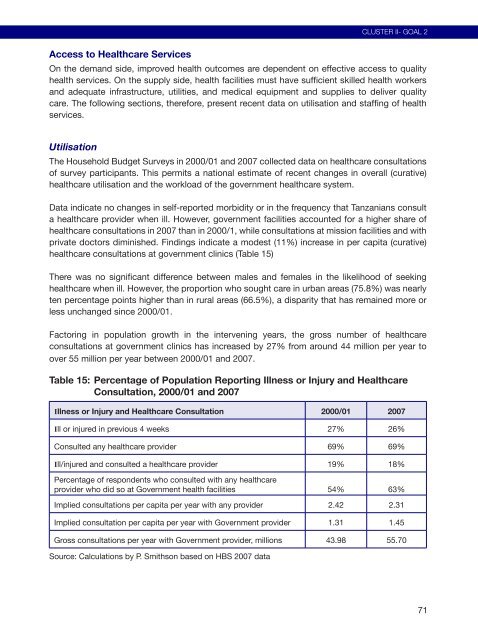
Table 15: Percentage of Population <strong>Report</strong><strong>in</strong>g Illness or Injury <strong>and</strong> Healthcare<br />
Consultation, 2000/01 <strong>and</strong> 2007<br />
Illness or Injury <strong>and</strong> Healthcare Consultation 2000/01 2007<br />
Ill or <strong>in</strong>jured <strong>in</strong> previous 4 weeks 27% 26%<br />
Consulted any healthcare provider 69% 69%<br />
Ill/<strong>in</strong>jured <strong>and</strong> consulted a healthcare provider 19% 18%<br />
Percentage of respondents who consulted with any healthcare<br />
provider who did so at Government health facilities 54% 63%<br />
Implied consultations per capita per year with any provider 2.42 2.31<br />
Implied consultation per capita per year with Government provider 1.31 1.45<br />
Gross consultations per year with Government provider, millions 43.98 55.70<br />
Source: Calculations by P. Smithson based on HBS 2007 data<br />
CLUSTER II- GOAL 2<br />
71


