Poverty and Human Development Report 2009 - UNDP in Tanzania
Poverty and Human Development Report 2009 - UNDP in Tanzania
Poverty and Human Development Report 2009 - UNDP in Tanzania
Create successful ePaper yourself
Turn your PDF publications into a flip-book with our unique Google optimized e-Paper software.
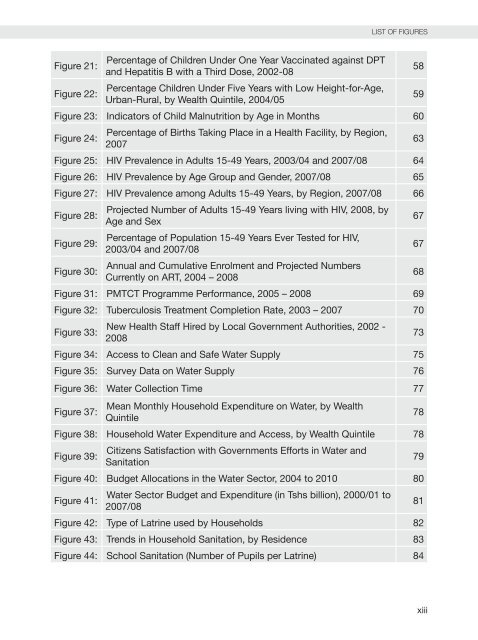
Figure 21:<br />
Figure 22:<br />
Percentage of Children Under One Year vacc<strong>in</strong>ated aga<strong>in</strong>st DPT<br />
<strong>and</strong> Hepatitis B with a Third Dose, 2002-08<br />
Percentage Children Under Five Years with Low Height-for-Age,<br />
Urban-Rural, by Wealth Qu<strong>in</strong>tile, 2004/05<br />
Figure 23: Indicators of Child Malnutrition by Age <strong>in</strong> Months 60<br />
Figure 24:<br />
Percentage of Births Tak<strong>in</strong>g Place <strong>in</strong> a Health Facility, by Region,<br />
2007<br />
Figure 25: HIv Prevalence <strong>in</strong> Adults 15-49 Years, 2003/04 <strong>and</strong> 2007/08 64<br />
Figure 26: HIv Prevalence by Age Group <strong>and</strong> Gender, 2007/08 65<br />
Figure 27: HIv Prevalence among Adults 15-49 Years, by Region, 2007/08 66<br />
Figure 28:<br />
Figure 29:<br />
Figure 30:<br />
Projected Number of Adults 15-49 Years liv<strong>in</strong>g with HIv, 2008, by<br />
Age <strong>and</strong> Sex<br />
Percentage of Population 15-49 Years Ever Tested for HIv,<br />
2003/04 <strong>and</strong> 2007/08<br />
Annual <strong>and</strong> Cumulative Enrolment <strong>and</strong> Projected Numbers<br />
Currently on ART, 2004 – 2008<br />
Figure 31: PMTCT Programme Performance, 2005 – 2008 69<br />
Figure 32: Tuberculosis Treatment Completion Rate, 2003 – 2007 70<br />
Figure 33:<br />
New Health Staff Hired by Local Government Authorities, 2002 -<br />
2008<br />
Figure 34: Access to Clean <strong>and</strong> Safe Water Supply 75<br />
Figure 35: Survey Data on Water Supply 76<br />
Figure 36: Water Collection Time 77<br />
Figure 37:<br />
Mean Monthly Household Expenditure on Water, by Wealth<br />
Qu<strong>in</strong>tile<br />
Figure 38: Household Water Expenditure <strong>and</strong> Access, by Wealth Qu<strong>in</strong>tile 78<br />
Figure 39:<br />
Citizens Satisfaction with Governments Efforts <strong>in</strong> Water <strong>and</strong><br />
Sanitation<br />
Figure 40: Budget Allocations <strong>in</strong> the Water Sector, 2004 to 2010 80<br />
Figure 41:<br />
Water Sector Budget <strong>and</strong> Expenditure (<strong>in</strong> Tshs billion), 2000/01 to<br />
2007/08<br />
List Of fiGUres<br />
Figure 42: Type of Latr<strong>in</strong>e used by Households 82<br />
Figure 43: Trends <strong>in</strong> Household Sanitation, by Residence 83<br />
Figure 44: School Sanitation (Number of Pupils per Latr<strong>in</strong>e) 84<br />
58<br />
59<br />
63<br />
67<br />
67<br />
68<br />
73<br />
78<br />
79<br />
81<br />
xiii


